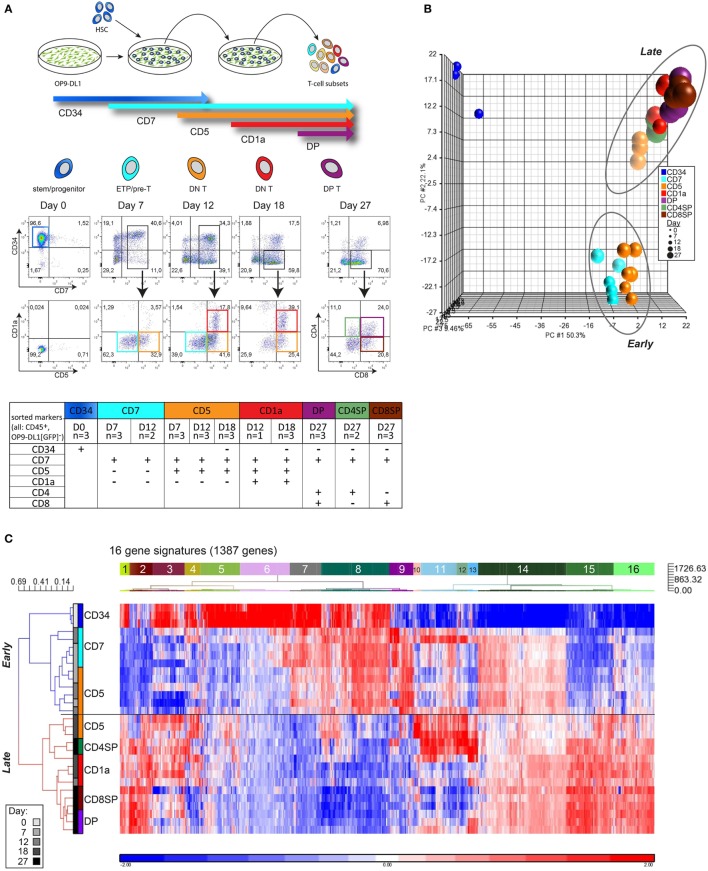
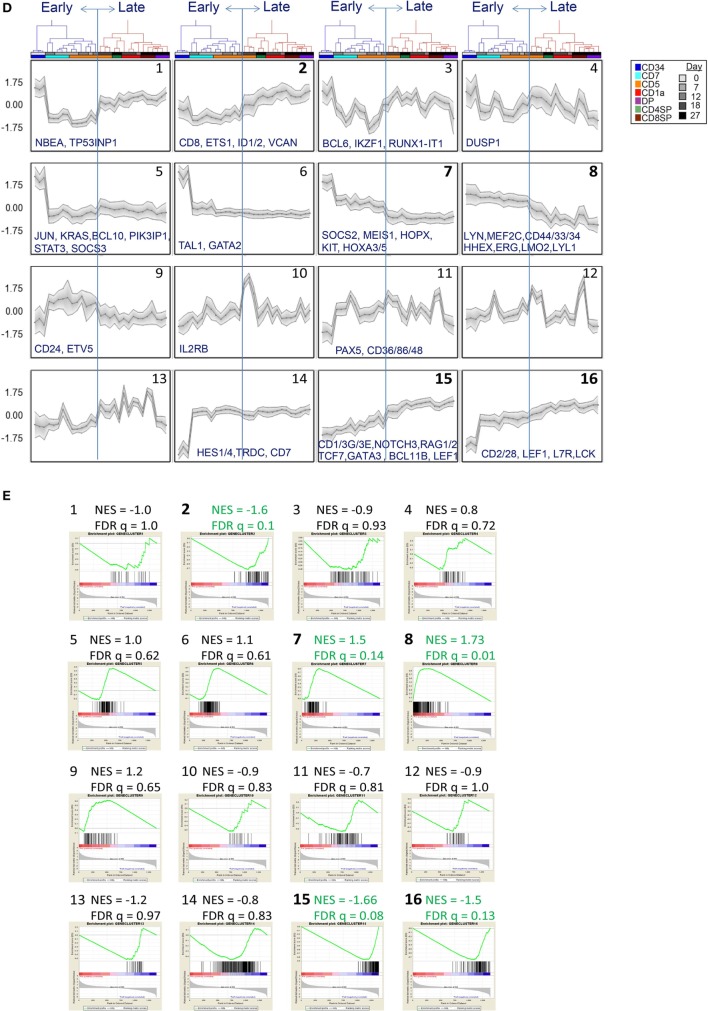
Figure 1.
Consecutive stages of human early in vitro T-cell differentiation represent two major gene signatures. (A) Schematic representation of the OP9-DL1 coculture with the sorting strategy of consecutive T-cell differentiation stages. The table displays the sorted populations (and the replicates, from a total of five cocultures) based on surface markers (CD45, CD34, CD7, CD5, CD1a, CD4, CD8) and number of days in coculture. All populations were also gated for CD45+GFP− to exclude OP9-DL1 cells that are GFP positive. (B) Principal component analysis of 29 samples based on the 2,179 probesets with high variance (top 5%) and log2 expression values (>8). These probesets were summarized into 1,387 genes by taking the median of all probesets across a gene. UCB-derived CD34+ stem cells (dark blue, upper left corner), an early, and a late population can be distinguished. (C) Hierarchical clustering analysis using 1,387 genes (see Table S1 in Supplementary Material). Pearson dissimilarity measure and average linkage were applied to cluster the samples, and Euclidean distance and Ward’s method were applied to define 16 distinct gene signatures with similar expression patterns. (D) Average expression pattern of genes in the 16 gene signatures; some example genes are displayed. z-scores are on the y-axis and 29 populations on the x-axis, ordered according to Figure 1C. The gray area represents 1SD. (E) Gene set enrichment analysis on the in vitro T-cell differentiation dataset to select gene signatures that are significantly enriched in the early or late T-cell program (marked in green and bold). The Normalized Enrichment Score (NES) and false discovery rate (FDR) q-value for each gene signature are given on top of each sub-figure. Populations belonging to the early/late T-cell program were determined according to Figure 1C. Gene sets with FDR q ≤ 0.25 were considered significantly correlated to the class distinction (22).


