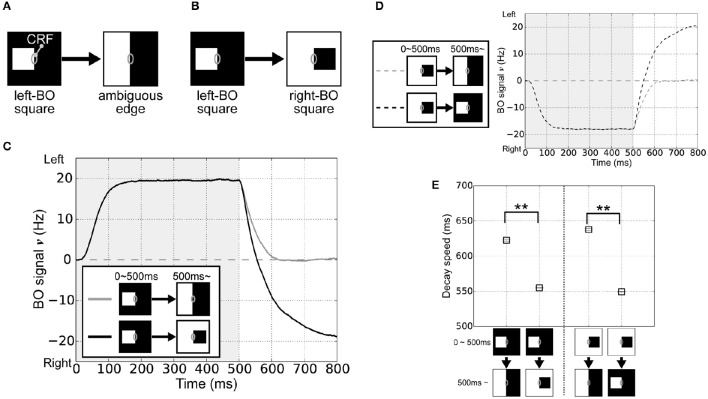
Figure 2.
Visual stimuli in the corresponding physiological experiment (O'Herron and von der Heydt, 2009) and V2 module responses. (A) Schematic representations of the stimuli used in the simulations; where the gray ovals indicate the CRF. The right edge of a white square was first presented in the CRF of BO-selective model cells (time < 500 ms) and then switched to an ambiguous edge (time > 500 ms). (B) The other stimulus used in the simulations. On the CRF of the BO-selective model cells, the first figure (right edge of a white square: time < 500 ms) was replaced by a second (left edge of a black square; time > 500 ms). (C) Time-course of the average BO signal ν (based on 20 simulation trials). Gray and black lines indicate the time-course of BO signals ν for stimulus sets (A,B), respectively. The BO signal ν for the stimulus set (B) without ambiguity was modulated more rapidly than that was for set (A), which included the ambiguous edge. (D) Time-course of the BO signal ν when the right-BO square was presented as the first figure. (E) Neural decay speed of the BO signal ν. Asterisks indicate significant differences between the stimulus sets (t-test: **p < 0.01; *p < 0.05).

