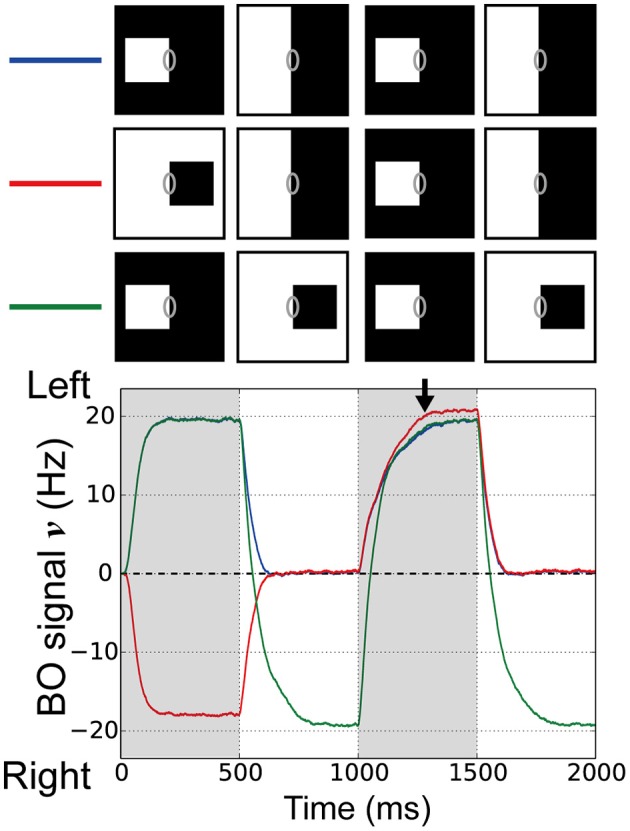
Figure 5.

Responses of BO-selective model cells in the V2 module with repeated figure presentation. Simulations of our model were performed using three stimulus conditions. In two conditions, the figures were presented twice with either the same DOF (blue line) or opposite DOF (red line), and each presentation was followed by 500 ms of ambiguous edge display. In the third condition, the figure was switched without presenting the ambiguous edge (green line). Stimuli presentation sequences are shown at the top. In all three conditions, the left-BO white square was presented as the third stimulus (1000–1500 ms). It should be noted that all three BO signals converged during this interval (arrow). Each new figure presentation resets the BO signal in our model, which agreed with physiological observations.
