Figure 6.
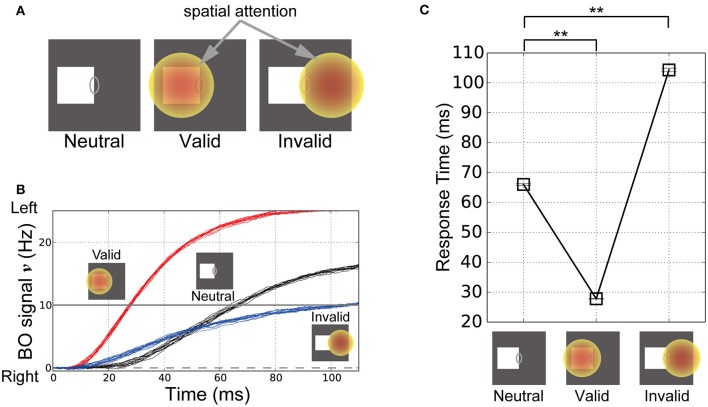
Stimuli in the corresponding classical psychophysical experiments (Posner, 1980) and time-course of the BO signal υ. (A) Stimuli and locations of spatial attention in the simulations of Posner's experiments. In these simulations, the right edge of a white square was presented in the CRF of BO-selective model cells. In the “Neutral” condition, spatial attention was not given to the model (left panel). In the “Valid” condition, there was spatial attention at the center of the presented square (center panel). In the “Invalid” condition, spatial attention was applied outside the square in the opposite direction relative to the CRF (right panel). (B) Time-courses of the BO signals ν for the stimuli corresponding to (A) based on 20 simulation trials. Black, red, and blue lines indicate the time-courses of the BO signals ν for the Neutral, Valid, and Invalid conditions, respectively. The three icons at the top represent the three simulation conditions. (C) Mean response time of our model when the white square was presented (20 trials). Error bars represent the standard error, which are small. Response time was defined as the biological time when the BO signal exceeded a level of 10 Hz. Asterisks indicate significant differences between locations of spatial attention (t-test: **p < 0.01; *p < 0.05). The location of spatial attention significantly modulated the response time for visual perception.

