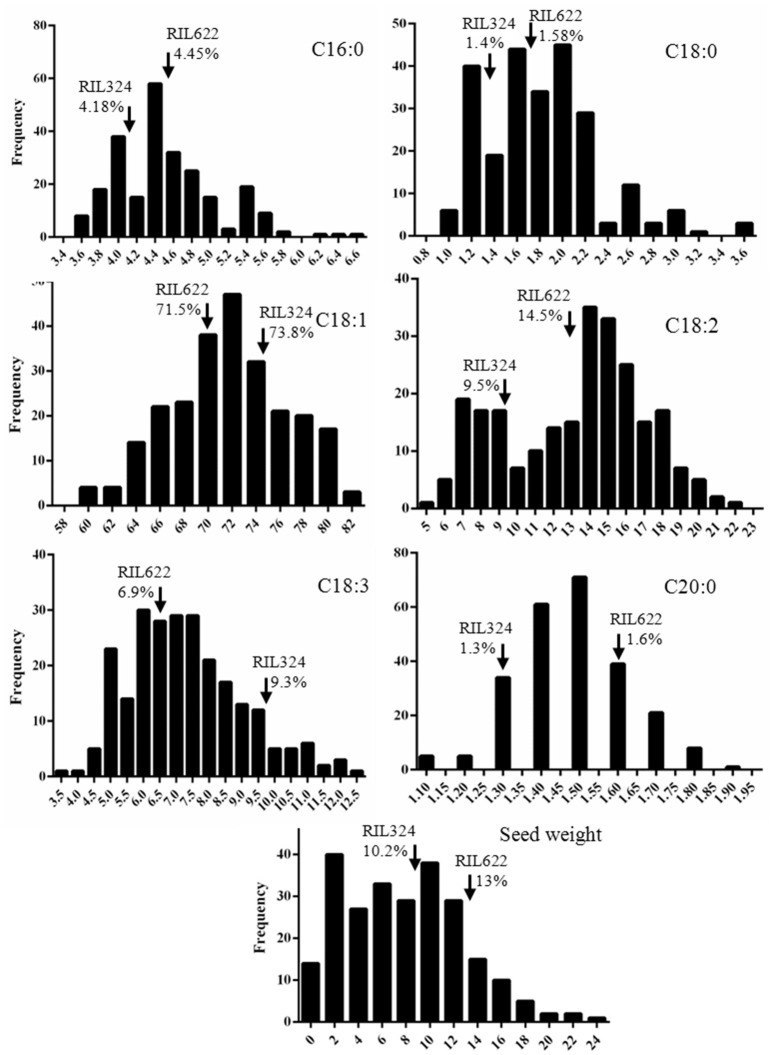
Figure 1.
Distribution of fatty acid concentrations in RIL324xRIL622 DH mapping population. Distribution of palmitic (C16:0), stearic (C18:0), oleic (C18:1), linoleic (C18:2), and linolenic (C18:3) fatty acid and seed weight in the RIL324xRIL622 B. napus mapping population lines. Fatty acids were measured as a percentage of the total oil content, mean values are represented as a frequency within the mapping population. Arrows represent fatty acid level in parental lines RIL324 and RIL622.

