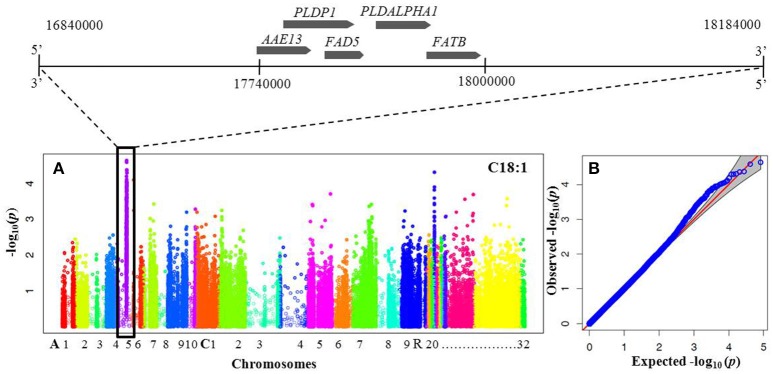
Figure 2.
Manhattan and quantile-quantile plots resulting from GWAS for oleic and linoleic fatty acids. (A) Manhattan plot for oleic (C18:1) and linoleic (C18:2) fatty acid concentration. X-axis indicates SNP location along chromosomes depicted with different colors: A1–A10, C1–C9 and random chromosomes 20–32 (according to the B. napus Darmor v4.1 reference genome http://www.genoscope.cns.fr/brassicanapus/), y-axis is the log10(p) (P-value). Peak of significantly associated SNPs visible on chromosome A05. Genomic region surrounding a significant GWA peak for C18:1 and C18:2 FAs shown along the top with candidate genes known to be involved in lipid metabolism are listed in Table 3 and Supplementary Table 2. (B) Quantile-quantile (Q-Q) plot of P-values for oleic acid and linoleic fatty acid. The Y-axis is the observed negative base 10 logarithm of the P-values, and the X-axis is the expected observed negative base 10 logarithm of the P-values under the assumption that the P-values follow a uniform (0,1) distribution.

