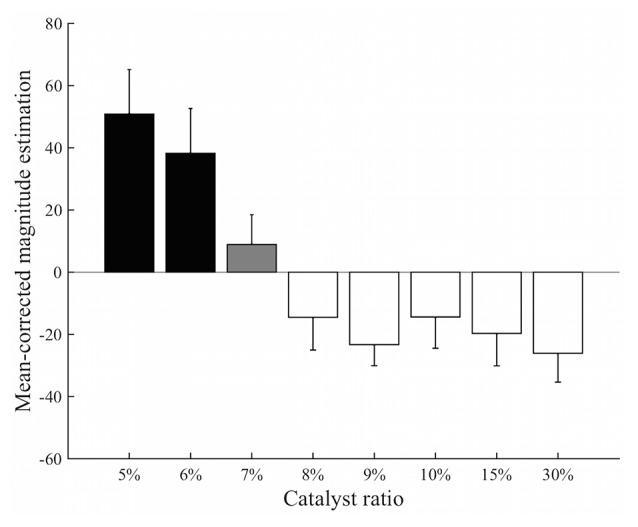
Figure 3.

Results from the magnitude estimation experiment. The post hoc analysis classified eight different levels of stickiness of stimuli into three distinct groups: 5% and 6% stimuli (black); 7% stimulus (gray); and the stimuli containing greater than an 8% catalyst ratio (white). Perceived intensity of the 7% stimulus was significantly different from those of the 5% and 6% stimuli and from those of the 8%–30% stimuli (p < 0.0001). There was no significant difference within each group (ps > 0.05).
