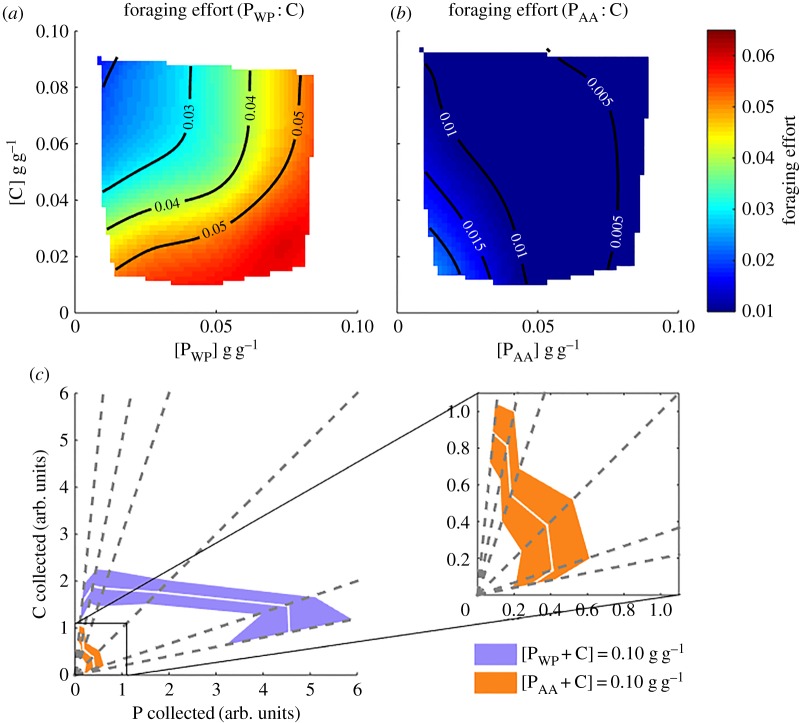
Figure 2.
Role of amino acid source on collective foraging behaviour. (a) Foraging effort (proportion of ants eating 2 h after we supplied fresh food) in whole protein diets as a function of [C] and [PWP] (R2 of surface regression = 0.758). (b) Foraging effort in free amino acid diets as a function of [C] and [PAA] (R2 of surface regression = 0.717). (c) Estimated carbohydrate and whole protein/free amino acid collection for diets where [P + C] = 0.10 g g−1 (white solid lines: mean values, purple patch: standard deviation around the mean for whole protein diets, orange: standard deviation around the mean for free amino acid diets). Inset: zoom of the estimated carbohydrate and free amino acid collection for free amino acid diets. Data are represented as mean ± s.d. Approximate [C] and [P] collection was multiplied by 103 for visualization purposes.

