Figure 4.

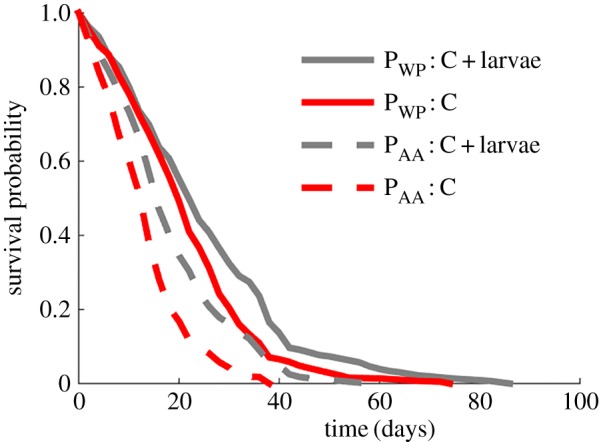
Effect of larvae presence on ant lifespan. Survival curves of subcolonies feeding on 5 : 1 PWP : C or PAA : C ratio diets ([P + C] = 0.10 g g−1) with and without larvae. Each curve represents six subcolonies.

Effect of larvae presence on ant lifespan. Survival curves of subcolonies feeding on 5 : 1 PWP : C or PAA : C ratio diets ([P + C] = 0.10 g g−1) with and without larvae. Each curve represents six subcolonies.