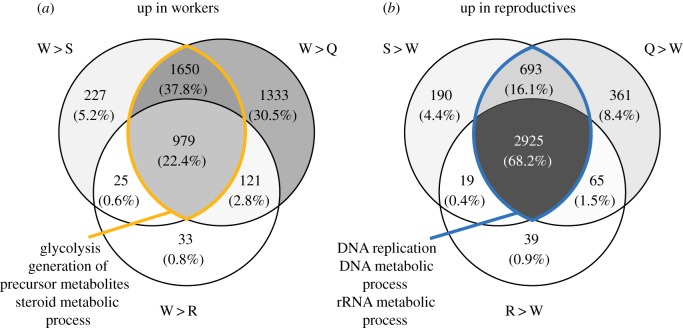
Figure 2.
Venn diagrams show genes (a) upregulated in workers relative to reproductive individuals and (b) upregulated in reproductive individuals relative to workers. Numbers in each subregion show the number of DEGs with an FDR < 0.05, and percentage of genes in that subregion relative to the universe of genes. Shading is relative to percentage of genes in each subregion, with darker regions corresponding to regions with higher percentages of genes. Yellow and blue highlighted regions show overlap between solitary and queen versus worker DEGs, respectively, and text refers to the top 3 significant enriched GO terms for genes in those regions. Q, queen; W, worker; S, solitary reproductive; R, replacement queen. (Online version in colour.)

