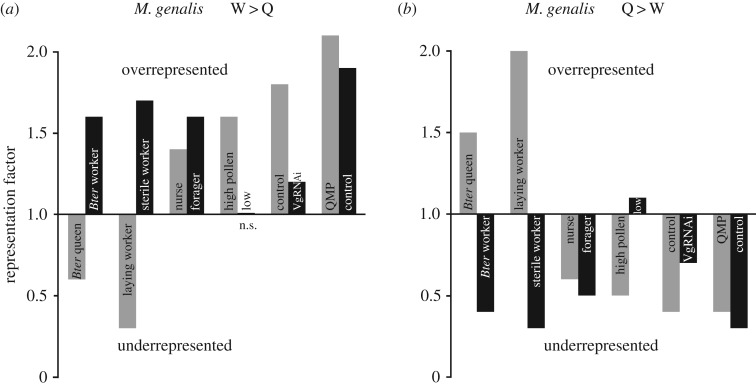
Figure 3.
Representation factors for overlap of M. genalis abdominal (a) worker > queen DEGs and (b) queen > worker DEGs with previous studies in Bombus terrestris (whole body [23]) and Apis mellifera (laying versus sterile worker, abdomen [54]; all other comparisons, fat body [55]). For each comparison, DEGs are split into two bars and labelled with the group more highly expressed (e.g. the black bar labelled ‘Bter worker’ in (a) shows the representation factor for W > Q genes in M. genalis and W > Q genes in B. terrestris). A representation factor (RF) of 1 indicates a level of overlap expected by chance, while RF > 1 indicates more overlap than expected and RF < 1 indicates less overlap than expected; n.s. not significantly different from RF = 1 (hypergeometric p > 0.05), all other bars are significantly different from RF = 1 (hypergeometric p < 0.05) in the direction shown.

