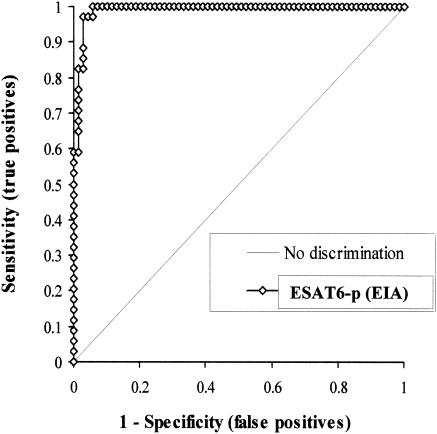
FIG. 2.
ROC curves for EIA with ESAT6-p. Se and Sp were calculated as follows: Se = (number of serum samples showing positive culture and EIA results at each cutoff value)/(number of M. bovis culture positive results). Sp = (number of serum samples showing negative culture and EIA results at each cutoff value)/(number of M. bovis culture negative results). Both Se and Sp were based on the results of the M. bovis culture method as the standard and compared the two tests (culture versus EIA).

