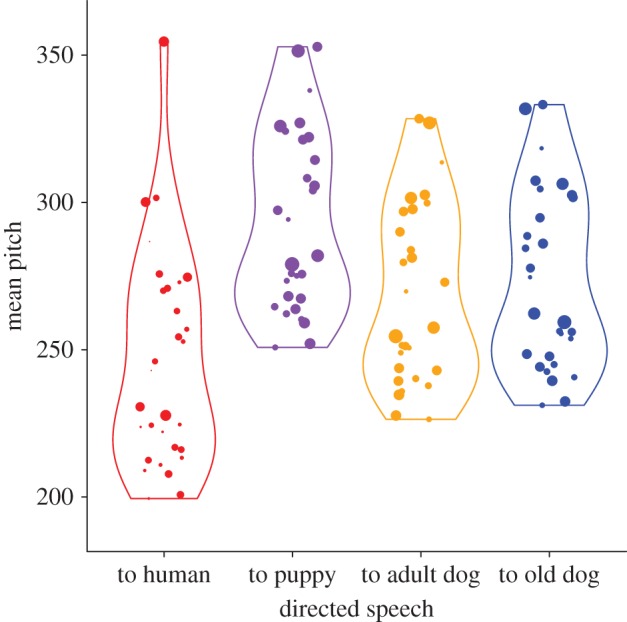
Figure 1.

Influence of recording condition on speech quality. X-axis = recording conditions (directed speech to human adult, puppy, adult and old dog respectively). Y-axis = mean pitch of the recorded speech sequence. Each dot represents a single recording of the same speech sequence from different human adult speakers (each speaker was recorded in each of the four recording conditions; see main text for description of the recorded speech sequence). The size of dots is proportional to the degree of acoustic periodicity (ratio of harmonics to noise in the signal) of the recorded speech sequence. Violin plots show the distribution's density and dots are jittered horizontally for better visualization. (Online version in colour.)
