
Figure 2.
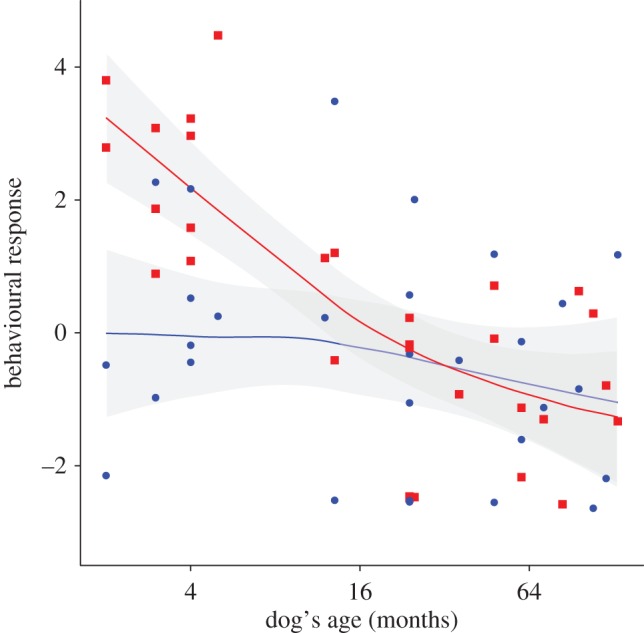
Dogs' behavioural reaction to playback of speech sequences. X-axis = dogs' age in months (logarithmic scale); Y-axis = dogs' behavioural reaction (represented as a principal component score PC1 calculated from 11 different behaviours; higher values mean stronger reaction to the playback signal). Each dot represents the result of one playback test. Each dog has been tested with two different speech qualities (red squares: reaction to puppy-directed speech; blue dots: reaction to human-directed speech). Solid lines = loess regression curves (degree of smoothing = 1; degree of polynomial = 1); grey shaded areas = confidence intervals. (Online version in colour.)