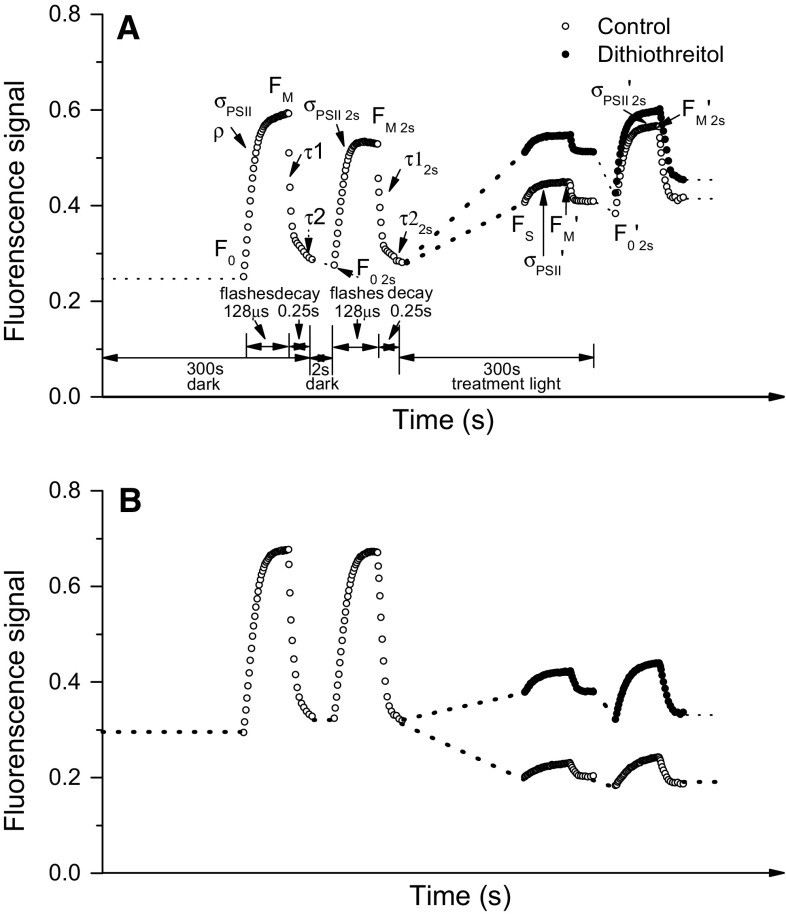
Fig. 2.
Representative chlorophyll fluorescence fast repetition rate (FRR) induction traces. a Temperate Micromonas NCMA 1646 grown at 20 °C and 185 μmol photons m−2 s−1. The initial black dashed line tracks a 300-s dark acclimation followed by FRR induction (open symbol trace) provoked by a train of 40 flashlets (1.2-μs duration, 2-μs intervening dark) applied over 128 μs that cumulatively close Photosystem II (PSII). We use a curve fit (PSIWORX-R; http://sourceforge.net/projects/psiworx/) of this initial FRR induction trace to extract the parameters F 0, the basal fluorescence in the dark acclimated state, F M, the maximal fluorescence with all PSII closed, and the induction parameters σ PSII, the effective absorbance cross section serving PSII photochemistry and ρ, a parameter for excitation connectivity among PSII centers, in the dark acclimated state (Kolber et al. 1998; Laney 2003; Laney and Letelier 2008). Following the train of saturating flashlets, our protocol slows the flash rate, allowing PSII to reopen over a 0.25-s span. We fit this curve of PSII reopening after the saturating flash with a two-phase exponential decay to define τ 1 and τ 2, the fast and slow decay lifetimes reflecting electron transport processes away from PSII (Kolber et al. 1998). After a further 2-s dark period to allow reopening of PSII, we applied a second FRR induction. The black dashed line then spans a subsequent 300 s incubation under a treatment light (400 μmol photons m−2 s−1 in this example) ending with an FRR induction (open symbols) under exposure to the treatment light to define, in the light-acclimated state, F S, the fluorescence in the light-acclimated state, F M′, σ PSII′, and ρ′. We then again applied an FRR induction after a further 2-s dark period to allow reopening of closed PSII centers, for measurement of F 0′2s, F M′2s, and σ PSII′2s Note that in these cells even 2 s of darkness allows a substantial increase from F M′ to F M′2s, reflecting significant relaxation of non-photochemical quenching within 2 s. We used the magnitude of the increase from F M′ to F M′2s to apply a proportional correction to F 0′2s to estimate the actual level of F 0′ that prevailed under illumination, for use in subsequent parameterizations (Table 2). The closed symbol line tracks an FRR induction under treatment light after addition of dithiothreitol to inhibit the xanthophyll cycle deepoxidase enzyme, followed by a 2-s dark period and an additional FRR induction. b Arctic Micromonas NCMA 2099 grown at 2 °C and 36 μmol photons m−2 s−1. The measurement protocol is the same as for Fig. 2a except the 300-s light treatment was at 97 μmol photons m−2 s−1 in this example. Note that the cells show a much larger downregulation of F M to F M′ after 300-s illumination, but that after a subsequent 2 s of darkness there is only a slight increase to F M′2

