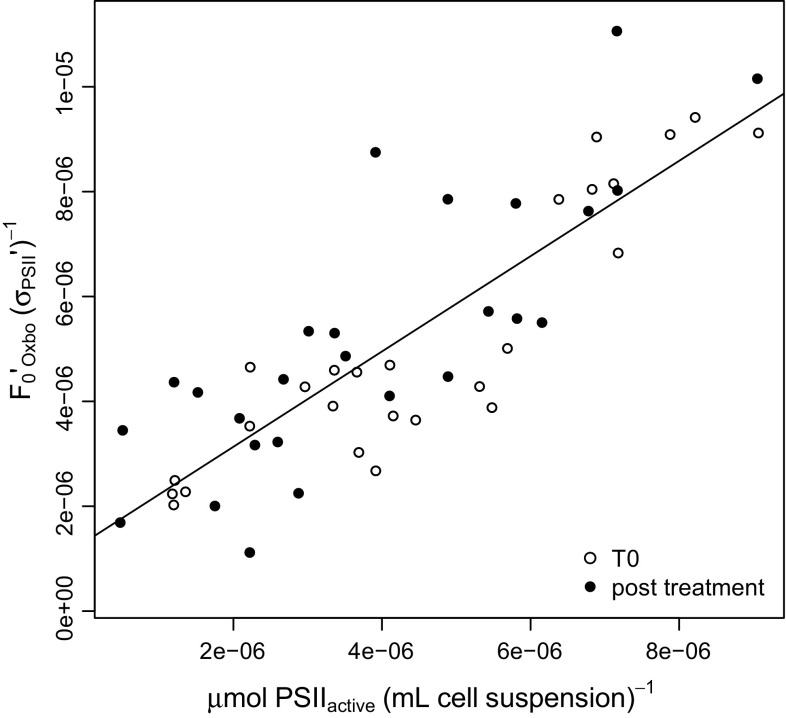
Fig. 4.
Fluorescence metric of [PSII]active, F 0′Oxborough/σ PSII′ plotted versus [PSII]active (µmol ml−1) determined from oxygen flash yields (Fig. 1). Open symbols show samples measured directly from growth conditions. Closed symbols show samples measured after a high-light treatment to induce some photoinhibition, with or without the presence of lincomycin to block PSII repair. Pooled linear regression with a slope 0.9088, intercept 1.317 × 10⁻⁶ and R 2 of 0.7139

