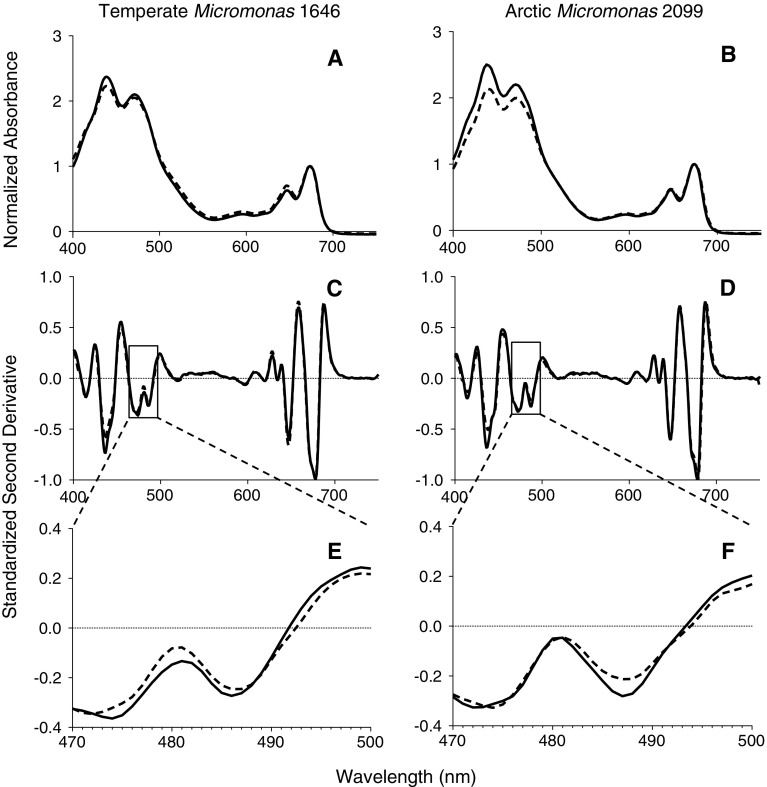
Fig. 7.
Whole-cell spectra. a, b Whole-cell visible spectra from temperate Micromonas NCMA 1646 (a) or arctic Micromonas NCMA 2099 (b) taken directly from growth conditions and captured in an integrating cavity to cancel cell suspension scattering of light. Spectra were normalized to the red chlorophyll peak before averaging. Consistent with the determinations of ā*, the whole-cell spectra were similar across strains and growth conditions. Averaged spectra of similar maximum OD from 3 separate cultures presented, 95 % CI omitted for clarity. Solid lines are the 185 μmol photons m−2 s−1 growth condition for temperate NCMA 1646 (a, c, e) and the 2 °C growth condition for arctic NCMA 2099 (b, d, f). Dashed lines are 36 μmol photons m−2 s−1 growth condition for NCMA 1646 (a, c, e) and the 10 °C growth condition for arctic NCMA 2099 (b, d, f). c, d Second-derivative spectra to detect inflection points of spectra from temperate NCMA 1646 (c) or arctic NCMA 2099 (d). Solid and dashed lines nearly overlay, except from 470 to 500 nm. e, f Second-derivative spectra from 470 to 500 nm in the carotenoid region from temperate NCMA 1646 (e) or arctic NCMA 2099 (f). Note the statistically significant difference (p < 0.05) at 487–488 nm between arctic NCMA 2099 grown at 2 °C (solid line) versus 10 °C (dashed line), reflecting differences in xanthophyll cycle pigment contents

