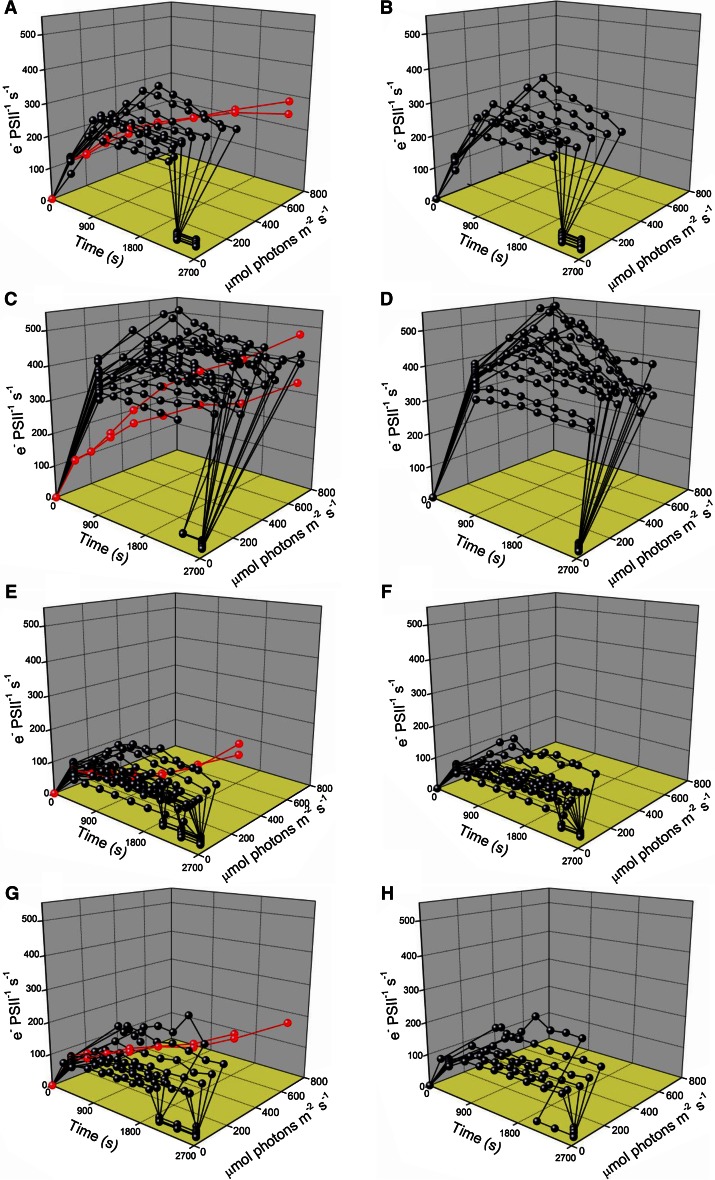
Fig. 8.
2D Plots of PSIIETR without and with lincomycin. Black symbols represent time course data, with data from individual time courses at a particular treatment light linked by connecting lines. Red symbols show light response curve data, with individual light response curves again linked by connecting lines. In the time course experiments, samples were initially measured after dark incubation (t 0 point). They were then exposed to the respective culture growth light (first point in time course) and then held at a treatment light for 4–7 × 300 s with an FRR measurement at the end of each 300-s interval (Fig. 2). Finally, they were shifted back to a low recovery light level of 12 μmol photons m−2 s−1 for a final 1–3 × 300 s, shown by the sharp drop in PSIIETR toward the end of the time course. a Temperate Micromonas NCMA 1646 grown at 20 °C and 20–36 μmol photons m−2 s−1 without lincomycin. b Temperate Micromonas NCMA 1646 grown at 20 °C and 20–36 μmol photons m−2 s−1 with lincomycin. c Temperate Micromonas NCMA 1646 grown at 20 °C and 185 μmol photons m−2 s−1 without lincomycin. d Temperate Micromonas NCMA 1646 grown at 20 °C and 185 μmol photons m−2 s−1 with lincomycin. e Arctic Micromonas NCMA 2099 grown at 2 °C and 20–36 μmol photons m−2 s−1 without lincomycin. f Arctic Micromonas NCMA 2099 grown at 2 °C and 20–36 μmol photons m−2 s−1 with lincomycin. g Arctic Micromonas NCMA 2099 grown at 10 °C and 20–36 μmol photons m−2 s−1 without lincomycin. h Arctic Micromonas NCMA 2099 grown at 10 °C and 20–36 μmol photons m−2 s−1 with lincomycin

