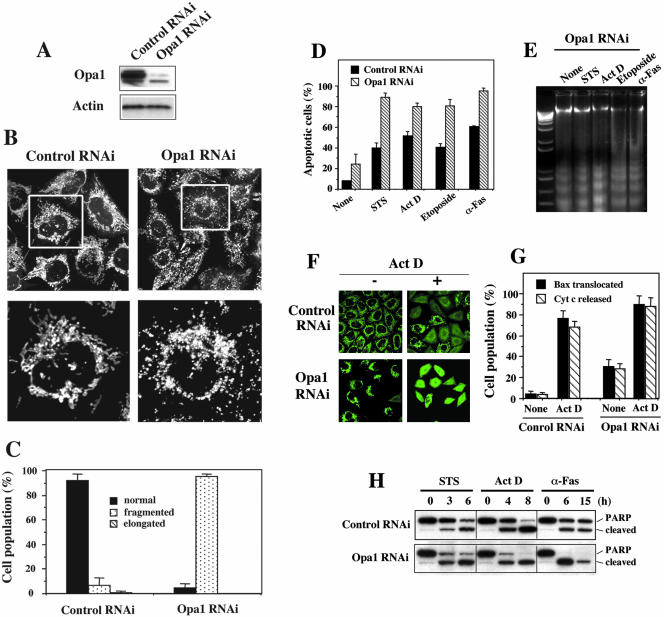
Figure 6.
Depletion of Opa1 induces mitochondrial fragmentation, and cells become very sensitive to apoptosis. HeLa cells were transfected with pREP4 constructs containing shRNA of the target sequence of Opa1 or control, and the transfectants were selected by growing in media containing hygromycin B. (A) total cell lysates from the Opa1 RNAi cells along with control RNAi cells were prepared and the expression level of Opa1 was analyzed by Western blotting. Actin level also was analyzed as a loading control. (B) Mitochondria of control RNAi cells and Opa1 RNAi cells were visualized with Mitotracker Red CMXRos and analyzed by confocal microscopy. Enlargements are shown for detailed structure of mitochondria. (C) Percentage of cell population with fragmented (dotted), normal (solid), or elongated (striped) mitochondria in control RNAi or Opa1 RNAi culture. At least 200 cells in several fields were counted in each experiment. Data represent the mean ± SD of at least three independent experiments. (D) Opa1-depleted cells along with control RNAi cells were treated with STS (1 μM; 6 h), Act D (10 μM; 8 h), etoposide (100 μM; 30 h), or anti-Fas antibody (500 ng/ml; 15 h), and apoptotic nuclei (stained with Hoechst) were scored and plotted as a percentage of total cells (at least 200 cells) counted. Data are shown as the mean ± SD of three independent experiments. (E) Total DNA was isolated from the cells treated as described above and analyzed by agarose gel electrophoresis and visualized with ethidium bromide. The first lane is a DNA ladder control. The figure shown is a representative of three independent experiments. (F) HeLa cells depleted of Opa1 along with control RNAi cells were incubated with or without Act D (10 μM) for 8 h in the presence of zVAD-fmk, fixed, and stained with anti-Bax (red; our unpublished data) and anti-cytochrome c antibodies (green). (G) The number of cells in F displaying Bax translocation or cytochrome c release was counted and plotted as a percentage of total cells counted in each RNAi cell population that had been treated with or without Act D and stained with anti-Bax and anti-cytochrome c antibodies (the same samples as shown in F). At least 200 cells were counted altogether in several fields. Data are plotted as the mean ± SD of at least three independent experiments. (H) PARP cleavage was analyzed in the total extracts from HeLa cells depleted of Opa1 and control that were treated with STS (1 μM; 0, 3, 6 h), Act D (10 μM; 0, 4, 8 h), or anti-Fas (500 ng/ml; 0, 6, 15 h). The figure is a representative of at least three independent experiments.

