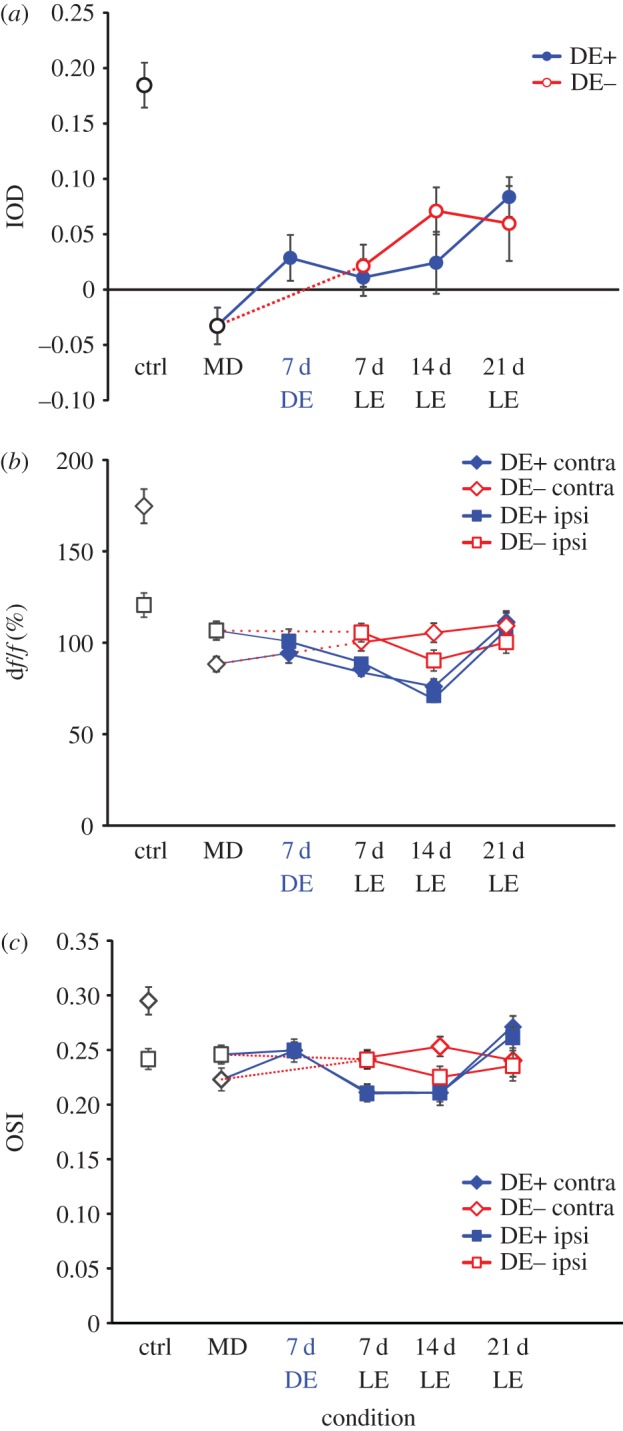
Figure 3.

Population responses of excitatory neurons in control animals, in monocularly deprived mice, and during recovery from MD (LE, light exposure). (a) Ocular dominance index; open red circles represent data from DE− mice, filled blue circles represent data from DE+ mice. (b) Magnitude of neuronal responses through the contralateral eye (diamonds) and the ipsilateral eye (squares) in control (ctrl, black symbols), DE+ (filled blue symbols) and DE− mice (open red symbols). (c) Orientation selectivity index of neuronal responses through the contralateral eye (diamonds) and the ipsilateral eye (squares) in control, DE+ and DE− mice.
