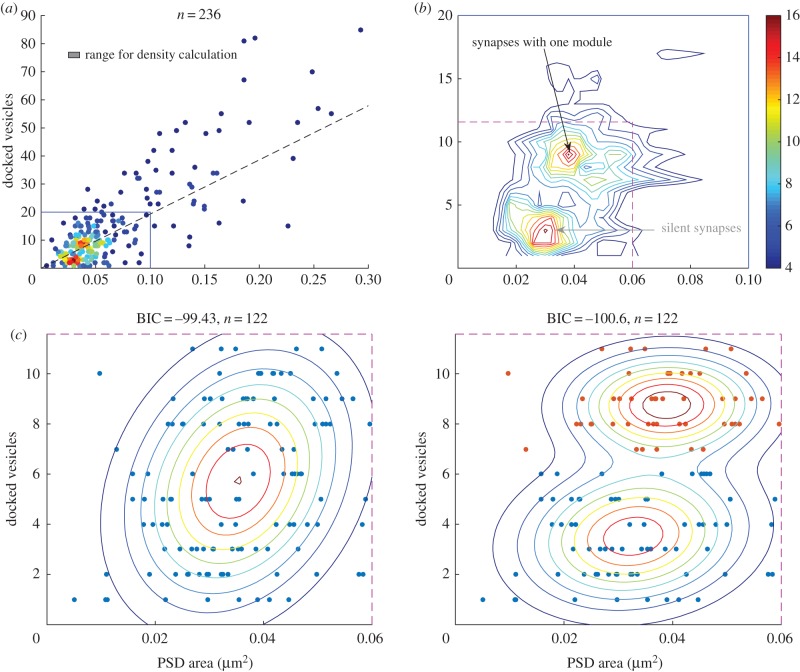
Figure 3.
EM data reveal two distinct groups of small synapses. (a) The number of docked vesicles for 236 synapses is plotted against their PSD areas. The dashed line represents the relation between PSD area and vesicle number as obtained in [13], and the point colour represents the local density of points within the range represented by the box. (b) Contour plot of the scatter plot (region outlined by blue lines in (a) exhibits two clusters of small synapses. The smallest synapses (bottom grey arrow) have an area of approximately 0.03 µm2 and only a small number of docked vesicles (approx. three vesicles). Slightly larger synapses (top black arrow) have an area of approximately 0.04 µm2 but have many more vesicles (approx. nine vesicles). The existence of two distinct types of small synapses, but with only small difference in average size, would suggest that the smaller size synapses might correspond to silent synapses, whereas the slightly larger ones might have a single AMPA-containing module. (c) Scatter points for small synapses are slightly better fit with a two-component (right panel, two groups are marked with different colours) than a one-component Gaussian mixture model (left panel). The smaller group has on average 0.033 µm2 of PSD area and 3.5 vesicles, whereas the larger group has 0.038 µm2 of PSD area and 8.8 vesicles. The fit qualities were evaluated by the BIC, which includes a penalty for more fitting parameters.

