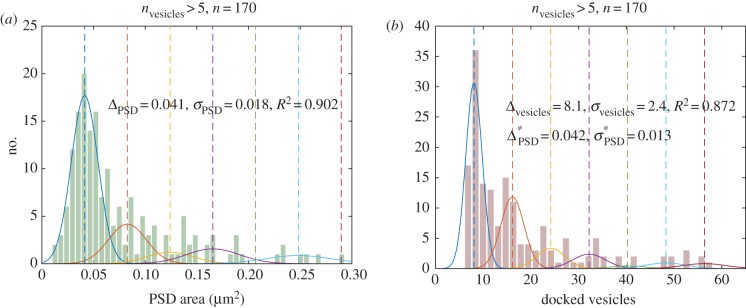
Figure 4.
Distribution of PSD area and the number of docked vesicles, as obtained by EM. (a) PSD area histogram and (b) docked vesicle histogram of 170 synapses (with more than five docked vesicles). We sought to assess whether these distributions were compatible or incompatible with quantally distributed states, each represented by a Gaussian distribution. Each dashed line marks the peak location, and the solid curve with the same colour represents the individual Gaussian distribution. The quantal increment of PSD area obtained from fitting the PSD area distribution is  , while the fit to the vesicle number distribution obtained
  , which can be converted to
  using the relation between PSD area and vesicle number obtained from Bartol et al. [13]. Both estimates for the quantal increment of PSD area are roughly consistent with the super-resolution observations (single module 0.060 µm2). This increment in PSD area is accompanied by the addition of approximately eight vesicles. From the PSD area data, the normalized amplitudes of the first two peaks are
  and
and  , whereas those from the vesicle data are
  and
and  , indicating that about approximately 75% of the synapses contain fewer than two modules.

