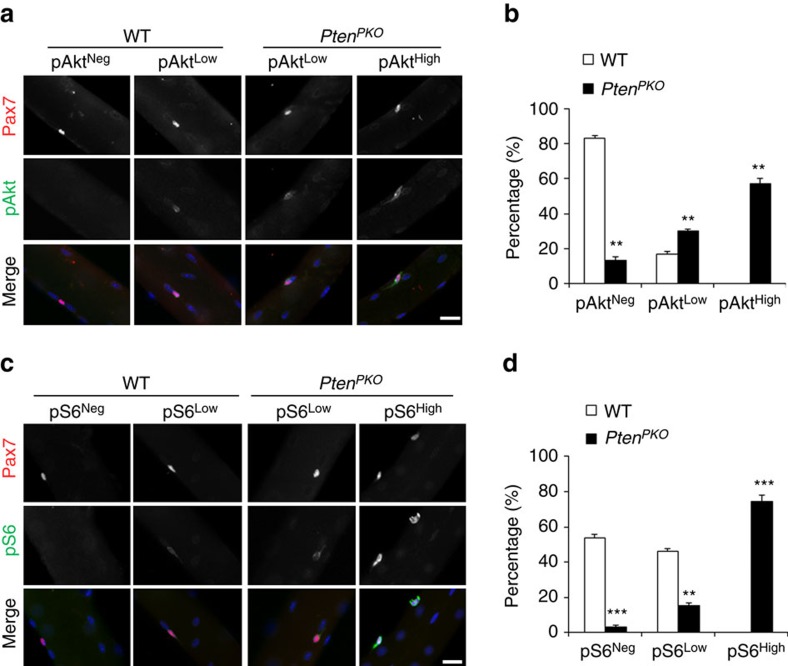
Figure 5. Activation of Akt and mTOR pathways in Pten-deficient SCs.
(a) Immunofluorescence of pAkt in SCs on freshly isolated EDL myofibers of WT and PtenPKO mice 4 days after TMX induction. Scale bar, 20 μm. (b) Quantification of the percentages of pAktNeg, pAktLow and pAktHigh SCs shown in (a). Data represent mean±s.e.m. (t-test: **P<0.01; n=3, each group; 15 myofibers per animal). (c) Immunofluorescence of pS6 in SCs on freshly isolated EDL myofibers of WT and PtenPKO mice 4 days after TMX induction. Scale bar, 20 μm. (d) Quantification of the percentages of pS6Neg, pS6Low and pS6High SCs shown in (c). Data represent mean±s.e.m. (t-test: **P<0.01; ***P<0.001; n=3, each group; 15 myofibers per animal).

