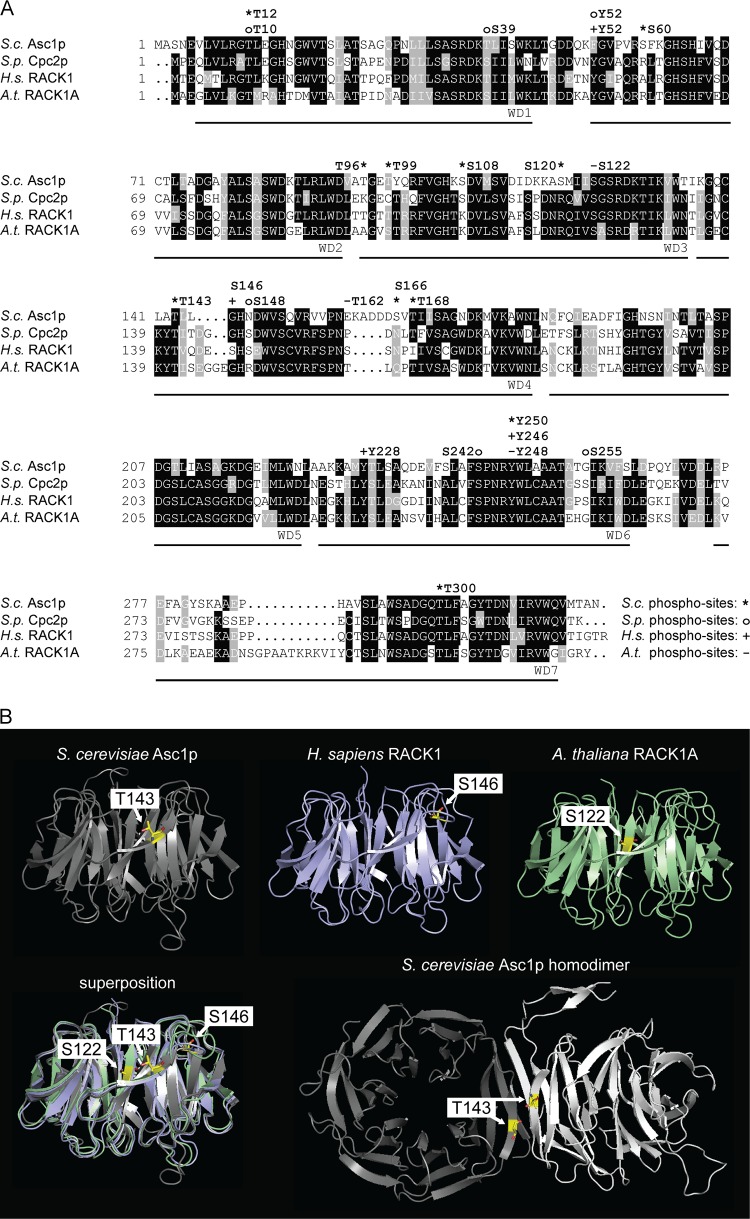
FIG 8.
Phosphosites within Asc1p and its orthologues. (A) Amino acid sequence alignment of Asc1p and its orthologues, with phosphosites. Amino acid residues that are conserved in at least three of the depicted sequences are shaded in black, and those that are similar in at least three sequences are shaded in gray. Phosphosites are indicated above the sequences. For S. cerevisiae Asc1p (S.c. Asc1p), phosphosites T12 (this study), S60 (68), T96 and T99 (69), S108 and S120 (23), T143 (this study), S166 and T168 (24), and Y250 and T300 (this study) are indicated with asterisks. For S. pombe Cpc2p (S.p. Cpc2p), phosphosites T10, S39, Y52, S148, S242, and S255 (34) are labeled with circles. Phosphosites S122, T162, and Y248 of A. thaliana RACK1A (A.t. RACK1A) (T161 of RACK1B and RACK1C) (22, 36) are indicated with minus signs, and phosphosites T50 (70), Y52 (71), S146 (18), Y228 (20), and Y246 (20, 37) of H. sapiens RACK1 (H.s. RACK1) are indicated with plus signs. The seven WD40 repeats are labeled below the sequences. Sequences were retrieved from the Uniprot database, aligned by use of the Clustal Omega program (http://www.uniprot.org/align/), and shaded with the BoxShade tool (http://www.ch.embnet.org/software/BOX_form.html). (B) Phosphorylation in the blade IV region of Asc1p/RACK1. Structures of S. cerevisiae Asc1p (gray), H. sapiens RACK1 (blue), and A. thaliana RACK1A (green) are shown with their respective phosphorylation sites, T143, S146, and S122, highlighted. Phosphosites are depicted as sticks, with carbon atoms shown in yellow, nitrogen atoms in blue, and oxygen atoms in red. Additionally, superpositioning of all three structures is depicted. The Asc1p homodimer is displayed with the two interacting Asc1p molecules in gray and white and with the T143 residues from both proteins highlighted. Structure figures were generated with the PyMOL Molecular Graphics System software on the basis of the PDB files 3FRX (Asc1p) (1), 4AOW (hRACK1) (72), 3DM0 (AtRACK1) (73), and 3RFG (Asc1p dimer) (38).

