FIG 2.
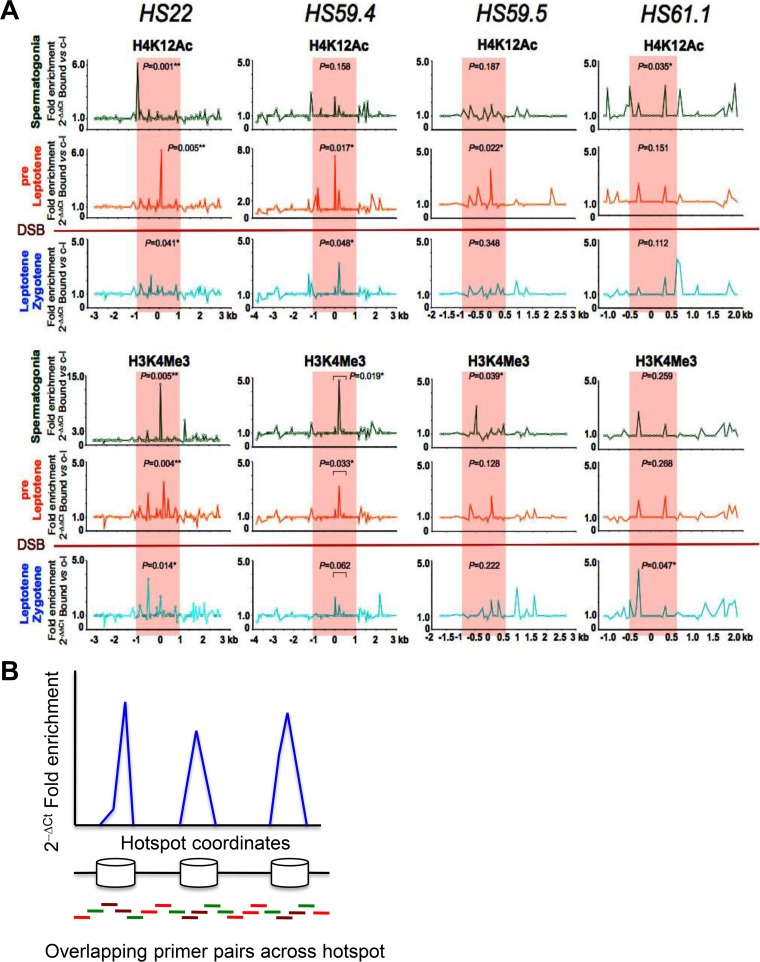
Profiles of active histone marks at mouse meiotic recombination hot spots in early meiotic prophase. (A) Representative normalized native ChIP profiles of the active H4K12Ac and H3K4Me3 histone marks are shown for the HS22, HS59.4, HS59.5, and HS61.1 hot spots in spermatogonium, preleptotene, and leptotene-zygotene meiotic cells. Normalized native ChIP profiles were obtained by real-time PCR data analysis for validated primer pairs that overlap these hot spots (see Materials and Methods and panel B). The y axis indicates the normalized absolute ratio of bound native ChIP fractions for a given histone mark versus the no-antibody control, using the 2−ΔΔCT formula. The x axis represents the location across the analyzed HS locus. Initial native ChIP profiles were obtained by calculating the absolute fold enrichment between bound and input ChIP DNA fractions, using the 2−ΔCT formula (see panel B). Each of the ChIP profiles shown is the average for three independent, normalized ChIP experiments. The Mann-Whitney test was performed to determine the statistical significance of the difference in normalized bound fractions for a given histone mark and the no-antibody control within either the entire hot spot core region or a specific subregion of the hot spot core, indicated with a bar, as described in Materials and Methods. Corresponding P values are depicted for each of the histone H4K12Ac and H3K4Me3 mark ChIPs at the HS22, HS59.4, HS59.5, and HS61.1 hot spot cores for three meiotic cell stages. *, P < 0.05; **, P < 0.01. Note that statistically significant P values were obtained for active histone mark enrichments within hot spot cores for at least one of the meiotic stages, and usually for at least one of or both the early spermatogonium and preleptotene meiotic stages, which precede the formation of DSBs. In the H3K4Me3 mark profile at the HS61.1 hot spot core, the most significant enrichment was observed for the leptotene-zygotene meiotic population. Red shading indicates the hot spot cores. The red line between the preleptotene and leptotene-zygotene meiotic stages indicates the stage when Spo11 generates DSBs. (B) Schematic of the real-time PCR technique used to obtain native ChIP profiles of histone marks and nucleosome occupancy profiles for mouse meiotic hot spots on chromosome 19. The native ChIP method used to generate profiles of histone modification marks across meiotic hot spots involved isolation of immunoprecipitation-enriched mononucleosomal, histone mark-associated DNAs from FACS-purified meiotic cell fractions, which were then further analyzed by real-time PCR using validated overlapping primer pairs across a given hot spot locus (96, 94, 48, and 41 primer pairs were used to tile the HS22, HS59.4, HS59.5, and HS61.1 hot spots, respectively) (34, 47) (also see Table S2). For nucleosome occupancy profiles (Fig. S2), mononucleosomal DNA was purified and used as a template for quantitative PCR, using the same overlapping primer pairs across several hot spot regions. In brief, nucleosomal DNA regions (blue peaks) were amplified with brown (robust PCR signal) and green (intermediate PCR signal) primer pairs, while DNA gaps between the nucleosomes were amplified with green and red primer pairs (trace PCR signal). Finally, native ChIP profiles and nucleosome occupancy profiles were obtained using the 2−ΔCT formula for bound and input ChIP DNA fractions and for the mononucleosome MNase-digested DNA fraction and undigested genomic DNA, respectively.

