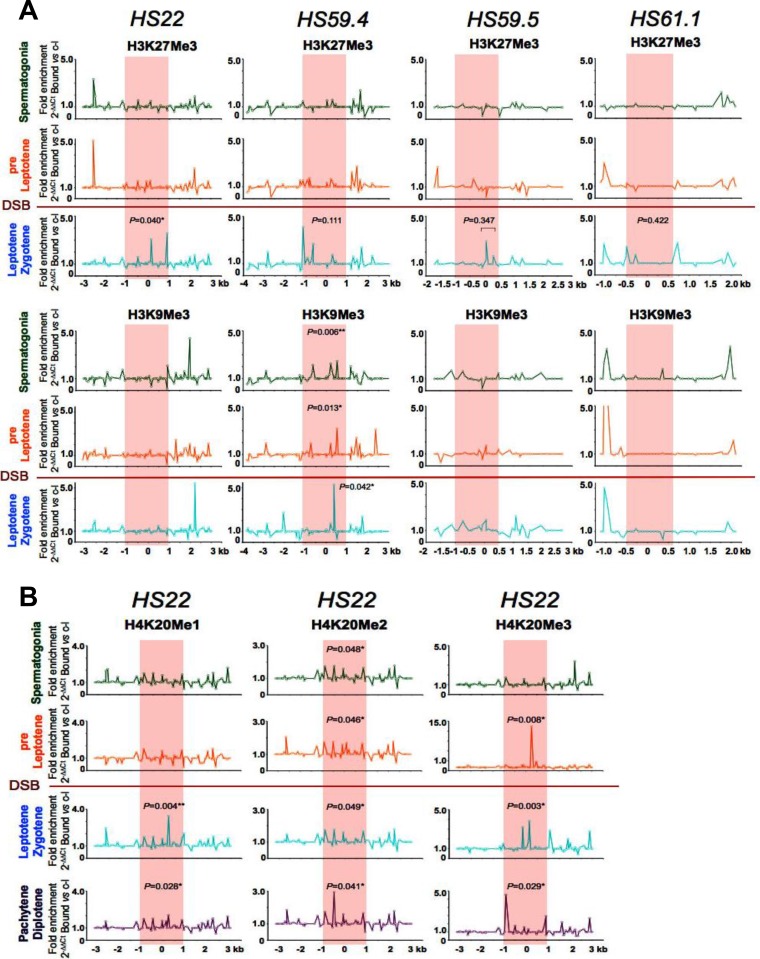
FIG 4.
Profiles of repressive methylated histone marks at mouse meiotic recombination hot spots in early meiotic prophase. (A) Representative normalized native ChIP profiles of the repressive H3K27Me3 and H3K9Me3 methylated histone marks are shown at the HS22, HS59.4, HS59.5, and HS61.1 hot spots in spermatogonium, preleptotene, and leptotene-zygotene meiotic cells. (B) Additional representative normalized native ChIP profiles of the repressive H4K20Me1, H4K20Me2, and H4K20Me3 methylated histone marks are shown at the HS22 hot spot for spermatogonium, preleptotene, leptotene-zygotene, and pachytene-diplotene meiotic cells. Normalized histone modification profiles in both panels were obtained as described in the legend to Fig. 2. ChIP profiles shown are averages for three independent, normalized ChIP experiments. The statistical significance of the histone mark enrichments within the HS22 hot spot core (if any) and P values were defined using the Mann-Whitney test as described in the legend to Fig. 2. *, P < 0.05; **, P < 0.01. Red shading, hot spot cores; red line, stage where Spo11 generates DSBs.

