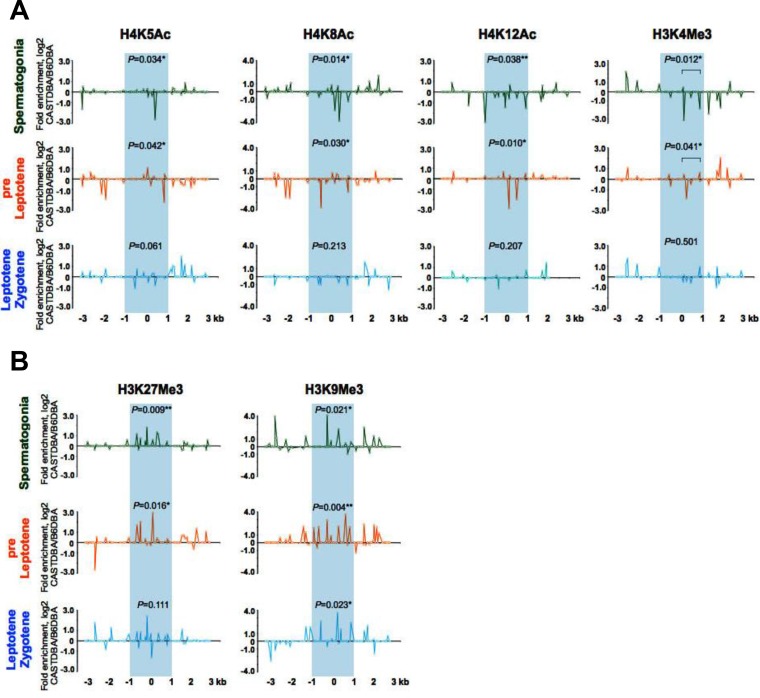
FIG 5.
Profiles of active and repressive acetylated and methylated histone H3 and H4 marks at the HS22 hot spot in inactive versus active mouse strain backgrounds. (A) Normalized log2(ΔΔCT) ratios of bound native ChIP fractions of active H4K5Ac, H4K8Ac, and H4K12Ac acetylated and H3K4Me3 methylated histone marks at the HS22 hot spot core in the inactive CAST/DBA strain versus the active B6/DBA mouse strain for spermatogonium, preleptotene, and leptotene-zygotene meiotic cells. (B) Normalized log2(ΔΔCT) ratios of bound native ChIP fractions of repressive H3K9Me3 and H3K27Me3 methylated histone marks at the HS22 hot spot core in the inactive CAST/DBA strain versus the active B6/DBA strain for spermatogonia and preleptotene and leptotene-zygotene meiotic cells. Inactive HS22 hot spot cores are indicated by blue shading in both panels. Normalized histone modification profiles were obtained as described in Materials and Methods. Data shown are averages for three independent, normalized ChIP experiments. The Mann-Whitney test was performed to determine the statistical significance (if any) of the difference in normalized bound fractions for a given histone mark within the HS22 hot spot core region or a specific subregion of the HS22 hot spot core, indicated with a bar, in the CAST/DBA and B6/DBA mouse strains, as described in Materials and Methods. Corresponding P values are depicted for each of the histone H4K5Ac, H4K8Ac, and H3K4Me3 mark ChIPs (A) and histone H3K27Me3 and H3K9Me3 mark ChIPs (B) at the HS22 hot spot core for three meiotic cell stages. *, P < 0.05; **, P < 0.01. Corresponding nonnormalized histone modification profiles at the HS22 core for three meiotic cell stages in the CAST/DBA and B6/DBA mouse strains are shown in Fig. S4.

