FIGURE 4.
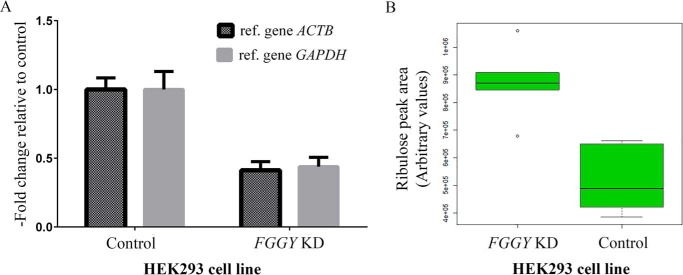
Ribulose accumulates in FGGY knockdown human cells exposed to ribitol. HEK293 FGGY knockdown (KD) and control cells were cultivated in DMEM supplemented with 10 mm ribitol. Metabolites and total RNA were extracted 41 h after addition of ribitol, and pentoses were measured using a targeted ZIC-HILIC-MS method. A, FGGY knockdown efficiency was evaluated using quantitative RT-PCR. The relative expression level of FGGY was estimated using the 2−ΔΔCt method. The expression level of the FGGY gene in each sample was either normalized to reference gene ACTB or GAPDH. Means and standard deviations of 12 (FGGY KD cells) and 11 (control cells) biological replicates are shown. B, box-and-whisker plot representing the area of the ribulose peak (m/z 149.0445, [M − H]− ion in the negative mode). Statistical analysis by Welch's t test confirmed that the mean ribulose peak area was significantly increased in the FGGY KD cells compared with the control cells (p value = 0.0005; six biological replicates for each cell line). KD, knockdown.

