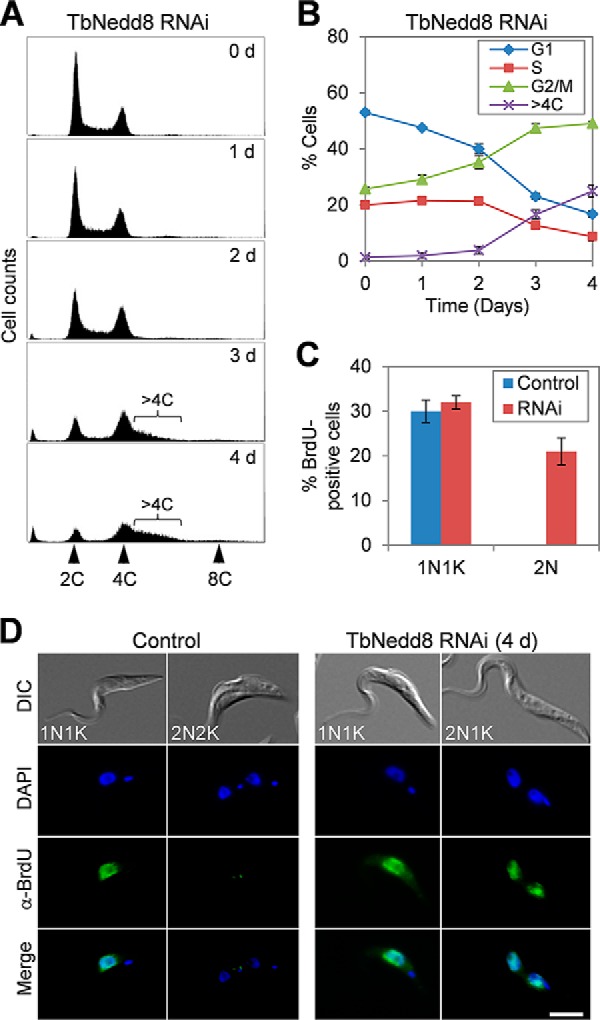
FIGURE 3.

RNAi of TbNedd8 results in DNA re-replication. A, flow cytometry analysis of TbNedd8 RNAi cells. Cells before and after RNAi induction were analyzed by flow cytometry, and shown are the flow cytometry histograms. d, day. B, quantification of flow cytometry assays. The percentage of cells at G1, S, and G2/M phases and the percentage of cells with more than 4C DNA content but less than 8C DNA content were plotted against time (days of RNAi induction). Error bars represent standard deviation calculated from three independent experiments. C, percentage of BrdU-positive cells in control and TbNedd8 RNAi cells (day 3). Data represent the average of three independent experiments, and the error bars represent standard deviation. D, BrdU incorporation in control and TbNedd8 RNAi cells (day 3). Cells were incubated with BrdU for 2 h and immunostained with anti-BrdU mAb. DIC, differential interference contrast. Scale bar = 5 μm.
