FIGURE 4.
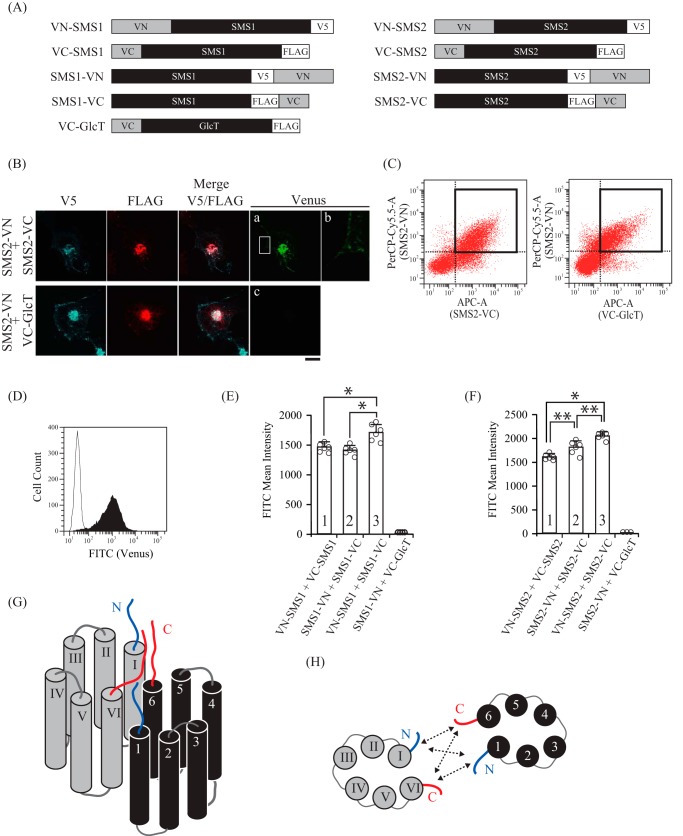
The two N-terminal tails, the N- and C-terminal tails, and the two C-terminal tails in the SMS homodimers are in close proximity. A, schematic of the chimeric proteins used for BiFC assays. The chimeras included VN (N-terminal residues 1–173 of the Venus protein) and V5 epitope or VC (C-terminal residues 155–238 of the Venus protein) and FLAG epitope. B–D, COS7 cells were transfected with a plasmid encoding V5-tagged SMS2-VN and FLAG-tagged SMS2-VC or V5-tagged SMS2-VN and FLAG-tagged VC-GlcT. 24 h post-transfection, the cells were fixed and permeabilized with 0.1% Triton X-100. For confocal microscopy (B), the cells were stained with anti-V5 and anti-FLAG antibodies, followed by appropriate Alexa Fluor-conjugated secondary antibodies. For flow cytometry (C and D), the cells were stained with anti-V5 antibody, followed by PerCP/Cy5.5-conjugated secondary antibody and APC-conjugated anti-FLAG antibody. B, SMS2-VN, blue; SMS2-VC or VC-GlcT, red; Venus, green. B, a close-up view of the plasma membrane in the squared region in a. Scale bar = 10 μm. C, representative dot plot from cells expressing SMS2-VN/SMS2-VC (left panel) and SMS2-VN/VC-GlcT (right panel). The gating of the double-positive cell population expressing both VN- and VC-fused proteins is shown as a bold square. D, FACS histogram representing the intensities of Venus fluorescence detected by the FITC channel in double-positive cells (PerCP-Cy5.5/APC). Histograms represent the extent of FITC quantified in cells expressing SMS2-VN/SMS2-VC (filled) or SMS2-VN/VC-GlcT (open). E and F, the intensity of Venus fluorescence in COS7 cells co-expressing the indicated combinations of VN- or VC-fused SMS1 (E) or SMS2 (F) was quantified by flow cytometry. Individual data points are shown as a scatterplot. Values represent the mean ± S.D. from at least three independent experiments. *, p < 0.01; **, p < 0.05. G and H, schematics of SMS homodimers, viewed as a section through the Golgi or plasma membrane (G) and viewed from the cytosolic space (H). Individual monomers of transmembrane segments in SMSs are shown in black and gray. N- and C-terminal tails are represented by blue and red lines, respectively. 1–6 and I-VI indicated the transmembrane helices. H, SMS1 and SMS2 have the following intermolecular interactions: between the N-terminal tails, between the N-terminal tail and C-terminal tail, and between the C-terminal tails, shown as dashed arrow lines.

