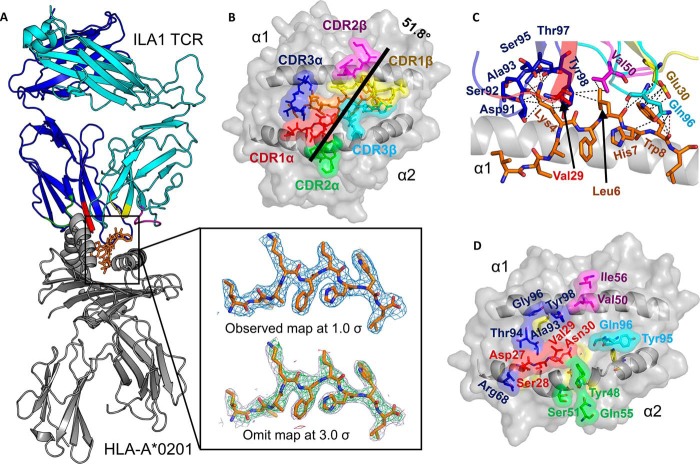
FIGURE 1.
The ILA1 TCR uses a broad binding footprint to engage A2-ILA. A, the overall binding mode of ILA1 TCR (blue and cyan schematic; CDR loops shown in multicolored schematic) in complex with A2-ILA (gray schematic and orange sticks). The box shows the observed map (top) at 1.0 σ and an omit maps (below) in which the model was refined in the absence of the ILA peptide with difference density contoured at 3.0 σ; positive contours are shown in green, and negative contours are shown in red. B, position of the ILA1 TCR CDR loops (multicolored sticks) with the ILA peptide (orange sticks) is shown in the HLA-A*0201 binding groove (gray surface). The crossing angle of the ILA1 TCR (black line) was calculated using previously published parameters (37). Briefly, this crossing angle represents the angle between a best fit straight line through the Cα atoms from the two MHC helices and a line that links the disulfide bond in the TCR α-chain variable region to the disulfide bond in the TCR β-chain variable region. C, interaction between residues in the ILA1 TCR CDR loops (multicolored sticks) and the ILA1 peptide (orange sticks) with the MHC α1 helix shown as a gray schematic. D, the ILA1 TCR residues in the CDR loops that contact the MHC surface are shown in multicolored schematic, and the surface with the MHC binding groove is shown in gray schematic and surface. CDR loops are colored as follows throughout: CDR1α, red; CDR2α, green; CDR3α, blue; CDR1β, yellow; CDR2β, purple; and CDR3β, cyan.

