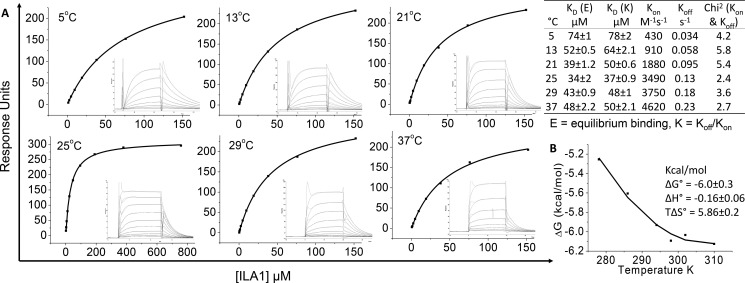
FIGURE 2.
Thermodynamic analysis of the ILA1 TCR with A2-ILA. A, eight to ten serial dilutions of the ILA1 TCR were injected in duplicate over A2-ILA at 5, 13, 21, 25, 29, and 37 °C. The equilibrium binding constants (KD) were calculated using a non-linear curve fit (y = (P1x)/P2 + x)), and kinetic and affinity parameters are shown in the table. B, the binding free energies, ΔG0 (ΔG0 = RT ln KD), were plotted against temperature (K) using non-linear regression to fit the three-parameter van 't Hoff equation (RT ln KD = ΔH0 − TΔS0 + ΔCp0(T − T0) − TΔCp0 ln(T/T0) with T0 = 298 K).

