FIGURE 4.

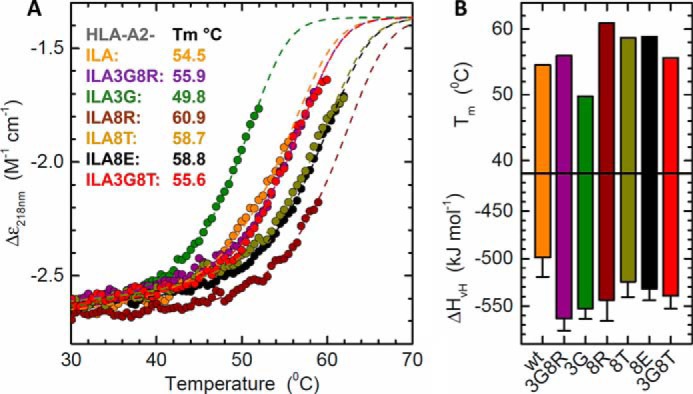
Stability of HLA-A2-ILA variants using circular dichroism. A, CD thermal denaturation curves recorded at 218 nm are shown for selected peptide-HLA class I samples. Dots represent measured values fitted assuming a two-state trimer-to-monomer transition (dashed lines) as described under “Experimental Procedures.” B, bar graphs of the thermal stability with respect to melting temperature (upper panel) and van 't Hoff's enthalpy of unfolding (lower panel). Error bars represent S.D. resulting from the multivariable curve fitting.
