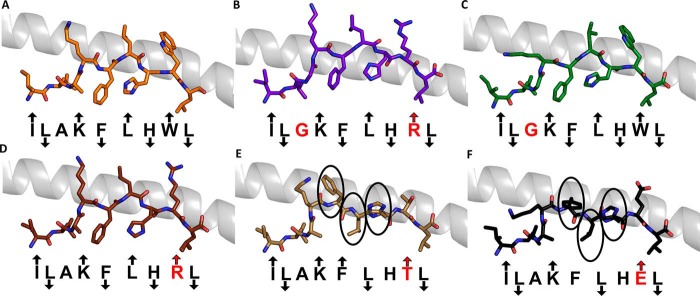
FIGURE 5.
Structural analysis of ILA1 TCR ligands. Shown is the conformation of each APL (sticks) demonstrating the direction of each residue in the peptide (solvent-exposed, MHC anchor, or in between) with the MHC α1 helix shown as a gray schematic. Residues in red indicate differences from the index sequence. An up arrow indicates solvent-exposed, a down arrow indicates anchor position, and no arrow indicates an intermediate position. A, A2-ILAKFLHWL (orange sticks). B, A2-ILGKFLHRL (purple sticks). C, A2-ILGKFLHWL (green sticks). D, A2-ILAKFLHRL (brown sticks) (reproduced from Ref. 23). E, A2-ILAKFLHTL (sand sticks). F, A2-ILAKFLHEL (black sticks). The circled residues in E and F face in different directions as compared with the index telomerase sequence (ILAKFLHWL) in A.

