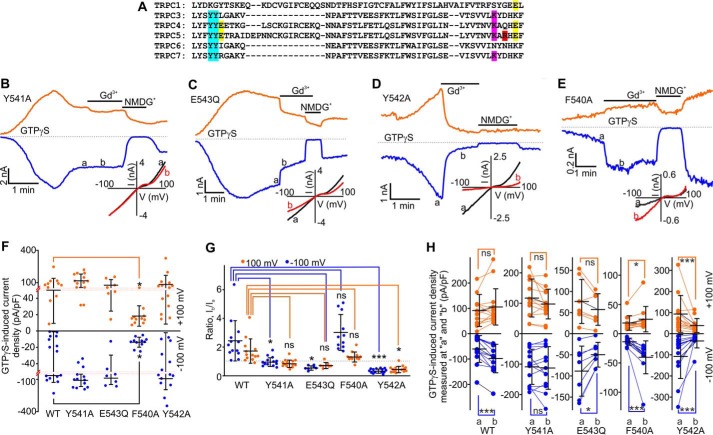
FIGURE 5.
Effects of Gd3+ on GTPγS-activated currents mediated by mouse TRPC5, mouse TRPC5Y541A, mouse TRPC5E543Q, mouse TRPC5Y542A, and mouse TRPC5F540A. A, the sequence alignment for mouse TRPC1, TRPC3, TRPC4, TRPC5, TRPC6, and TRPC7. The TRPC5's Tyr-541 and Tyr-542 residues are highlighted in sky blue. The glutamate residues Glu-543 and Glu-595 are highlighted in yellow. The Arg-593 residue in TRPC5 is highlighted in red. B–E, time courses of the whole-cell currents induced by a dialysis of 500 μm GTPγS in HEK cells overexpressing TRPC5 or one of the mutants listed above. Gd3+ (100 μm) and NMDGCl were added at the times indicated by the horizontal bars. The broken lines indicate the level of the zero current. The upper and lower traces represent the outward and inward whole cell currents recorded at +100 mV (orange lines) and −100 mV (blue lines). Insets show the current-voltage relations recorded in the absence (black lines) and presence (red lines) of Gd3+. F, comparison of the mean current densities of GTPγS-activated currents recorded at −100 mV (blue dots) and +100 mV (orange dots) in HEK cells transfected with TRPC5-WT, TRPC5Y541A, TRPC5Y542A, TRPC5F540A, or TRPC5E543Q. The red dotted lines show the positions where the y axis scale changes. G and H, summary data of current ratios and current densities measured at the time points of a and b at holding potentials of −100 mV (blue dots) and +100 mV (orange dots) for the data sets shown in B–E. The ratios quantify the relative current amplitude increases in the presence of Gd3+. In all five plots of H, the y axis label is GTPγS-induced current density measured at a and b (pA/pF). The vertical error bars represent standard deviation, and the mean values are indicated with horizontal bars (*, p < 0.05; ***, p < 0.001; ns, stands for not significant; one-way ANOVA on Rank followed by the all pairwise comparison Dunn's test in F and G, unpaired t test (black line in F), paired t test or Wilcoxon Signed Rank Test in H).

