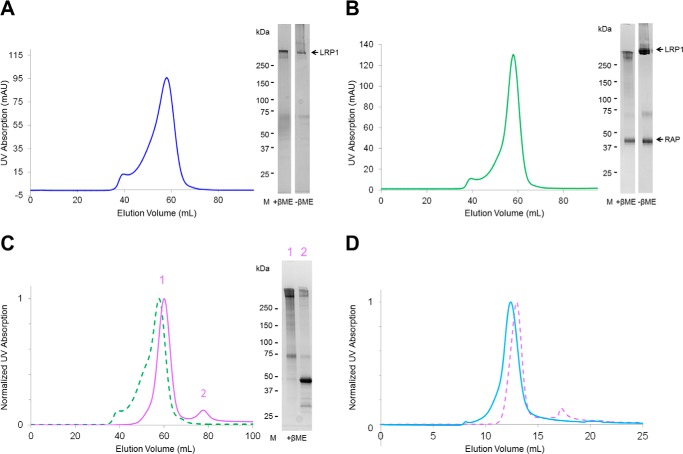
FIGURE 3.
Purification of full-length LRP1 ectodomain and LRP1-RAP complex, and dissociation of RAP at acidic pH. A, SEC profile at pH 7.5 of LRP1 and detection on SDS-PAGE gel. mAU, milliabsorbance units; M, molecular weight markers; βME, β-mercaptoethanol. B, SEC profile at pH 7.5 of LRP1-RAP complex after co-expression and detection on SDS-PAGE gel. C, SEC profile at pH 7.5 of LRP1-RAP complex (green dashed line) superposed to the SEC profile at pH 5.5 of LRP1-RAP (violet line) showing dissociation of LRP1 (peak 1) from RAP (peak 2); detection on SDS-PAGE after SEC at pH 5.5 of LRP1-RAP. D, SEC profile at pH 7.5 of LRP1 (blue line) after SEC at pH 5.5 of LRP1-RAP (violet dashed line) and dissociation of RAP (peak 1 from panel C).

