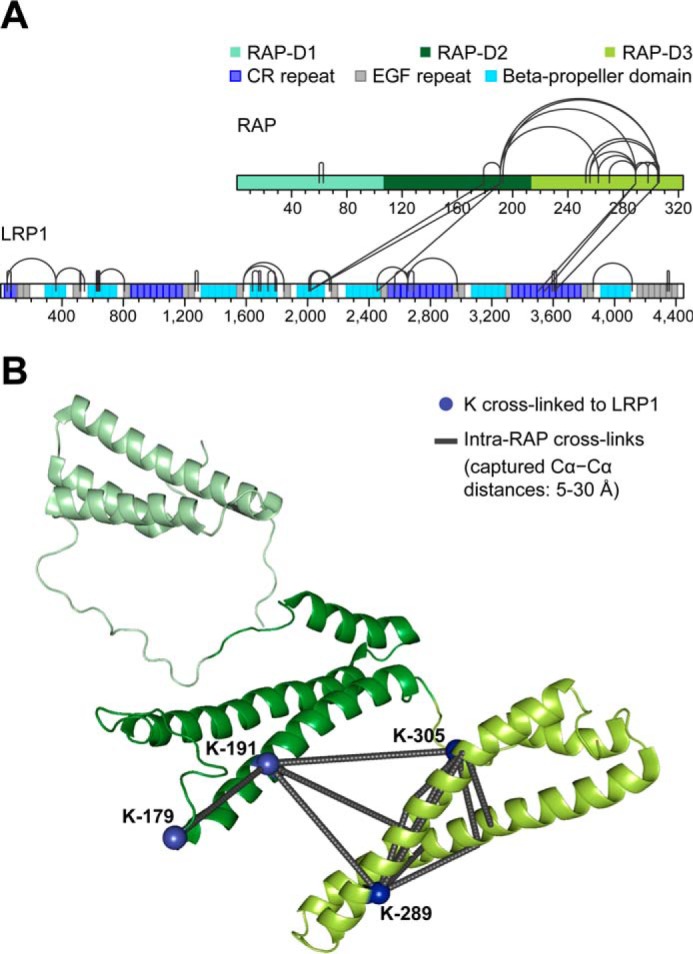
FIGURE 6.

Cross-linking MS analysis of the co-expressed LRP1-RAP complex. A, sequence bar plot of all identified cross-links. The domain boundaries within RAP and LRP1 are taken from Lee et al. (26) and from UniProt entry Q07954, respectively. B, structural representation of intramolecular RAP cross-links. The cross-links were mapped onto all structurally characterized RAP conformers (Protein Data Bank (PDB) entry 2P01). Shown here is the RAP conformer structure that agrees best with the cross-linking distance constraints. RAP lysines involved in intermolecular cross-links to LRP1 are depicted as blue spheres.
