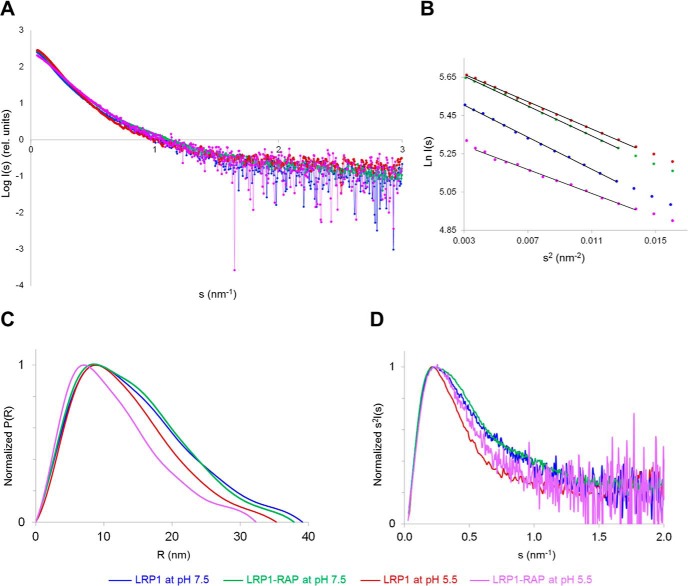
FIGURE 7.
SAXS analysis of LRP1 and LRP1-RAP complex at pH 7.5 and pH 5.5. LRP1 at pH 7.5 is shown in blue, LRP1-RAP at pH 7.5 is shown in green, LRP1 at pH 5.5 is shown in red, and LRP1-RAP at pH 5.5 is shown in violet. A, superposition of scattering curves scaled for comparison. rel. units, relative units. B, Guinier plot. C, normalized distance distribution function. D, normalized Kratky plot.

