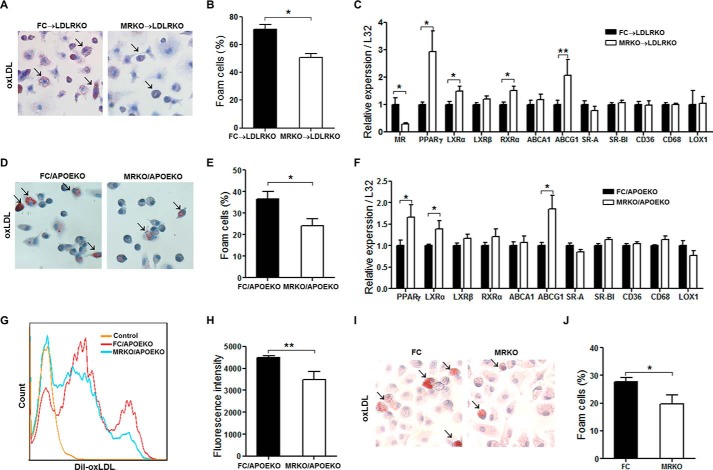
FIGURE 7.
Myeloid MR deficiency decreases foam cell formation. A, representative oil red O staining of foam cell formation ex vivo. BMDMs were isolated from Western diet-fed FC → LDLRKO or MRKO → LDLRKO mice and incubated with 50 μg/ml oxLDL for 20 h. Arrows point to positively stained cells. B, quantification of foam cell formation (n = 7). C, expression of genes related to cholesterol homeostasis in BMDMs incubated with 50 μg/ml oxLDL for 20 h (n = 7). RT-qPCR was used to measure the relative gene expression level. L32 was used as an endogenous control. D, representative oil red O staining of peritoneal macrophages from MRKO/APOEKO mice and FC/APOEKO mice incubated with 50 μg/ml oxLDL for 48 h. Arrows point to positively stained cells. E, quantification of peritoneal macrophage foam cell formation in vitro (n = 5). F, expression of genes related to cholesterol homeostasis in peritoneal macrophages incubated with 50 μg/ml oxLDL for 48 h (n = 5). G, representative flow cytometric analysis of peritoneal macrophages incubated with 5 μg/ml DiI-oxLDL for 12 h. H, quantification of the results of flow cytometric analysis (n = 4). I, representative oil red O staining of peritoneal macrophages from MRKO mice and FC mice incubated with 50 μg/ml oxLDL for 48 h. Arrows point to positively stained cells. J, quantification of I as foam cell formation (n = 3). *, p < 0.05; **, p < 0.01.

