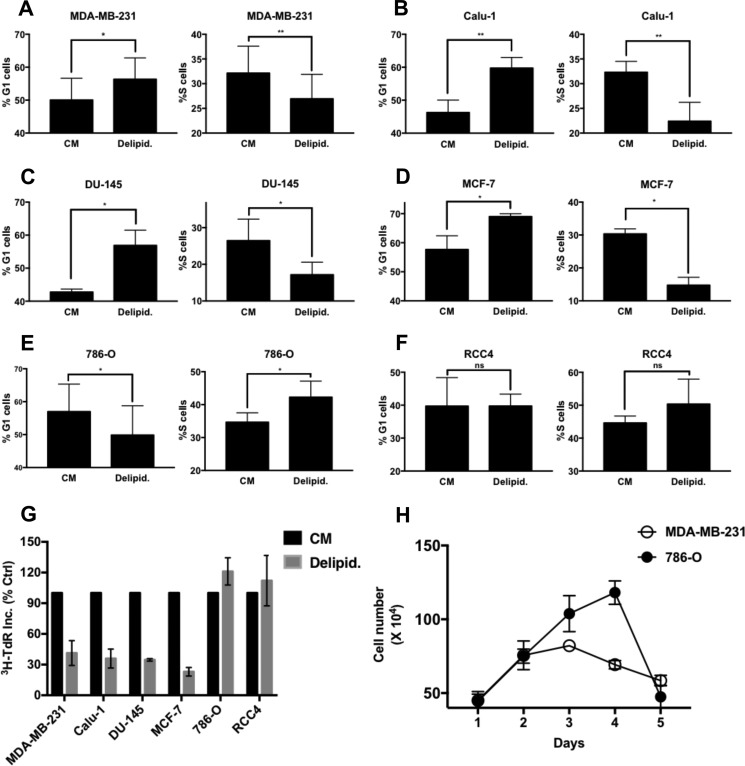
FIGURE 3.
Effect of lipid deprivation on cancer cell proliferation and cell cycle progression. A–F, MDA-MB-231, Calu-1, DU-145, MCF-7, 786-O, and RCC4 cells were plated at 30% confluence in CM in 10-cm plates. After 24 h, cells were shifted to CM or medium containing delipidated serum (Delipid.) for 48 h, at which time the cells were harvested, fixed, stained with propidium iodide, and analyzed for distribution in G1 and S-phase of the cell cycle by measuring DNA content/cell as described under “Experimental Procedures.” The percentage of G1 and S-phase cells in CM relative to that in delipidated serum is presented. Error bars represent the standard deviation from experiments repeated 3 times. G, the cells were plated in CM in 12-well plates and treated with conditions as explained in A. Cells were labeled with [3H]TdR for the final 24 h of treatment, after which the cells were collected and the incorporated label (3H-TdR Inc.) was determined by scintillation counting. Values were normalized to the cpm for CM, which was given a value of 100%. Ctrl, control; Error bars represent the standard deviation for experiments repeated 2 times. H, the proliferation of 786-O and MDA-MB-231 cells in delipidated serum was determined by counting the number cells over 5 days. Error bars represent the standard deviation for experiments repeated 2 times. Where indicated, paired t tests were performed using GraphPad Prism software (not significant (ns), p > 0.05; *, p < 0.05; **, p < 0.01).

