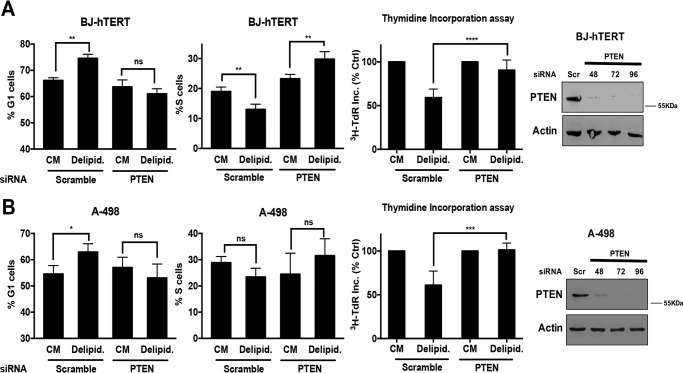
FIGURE 5.
Loss of PTEN promotes passage of the late G1 lipid checkpoint. A, BJ-hTERT cells were plated at 60% confluence in 6-well plates in CM. After 24 h, cells were transfected with either scrambled or PTEN siRNA. 24 h later, cells were transferred to CM or medium containing 10% delipidated serum (Delipid.) for 48 h. Cells were then collected and cell cycle distribution was determined as in Figs. 3 and 4. Error bars represent the standard deviation for experiments repeated 3 times. For thymidine incorporation assays, cells were labeled with [3H]TdR for the final 24 h of treatment, after which the cells were collected and the incorporated label (3H-TdR Inc.) was determined by scintillation counting. Ctrl, control. Values were normalized to the cpm for CM, which was given a value of 100%. Error bars represent the standard deviation for experiments repeated 4 times. Western blotting was also performed to check the levels of PTEN. The data shown are representative of experiments repeated 2 times. B, A-498 cells were plated at 60% confluence in 6-well plates in CM. After 24 h, cells were transfected with either scrambled or PTEN siRNA. 24 h later, cells were transferred to CM or medium containing 10% delipidated serum for 48 h. Cells were then collected, and cell cycle distribution was determined as in A. Error bars represent the standard deviation for experiments repeated 4 times. Thymidine incorporation assays were performed as in A. Error bars represent the standard deviation for experiments repeated 3 times. Paired t tests were performed as in Figs. 3 and 4. Western blotting analysis of PTEN levels was performed as in A. The data shown are representative of experiments repeated 2 times (not significant (ns), p > 0.05; *, p < 0.05; **, p < 0.01; ***, p < 0.001; ****, p < 0.0001).

