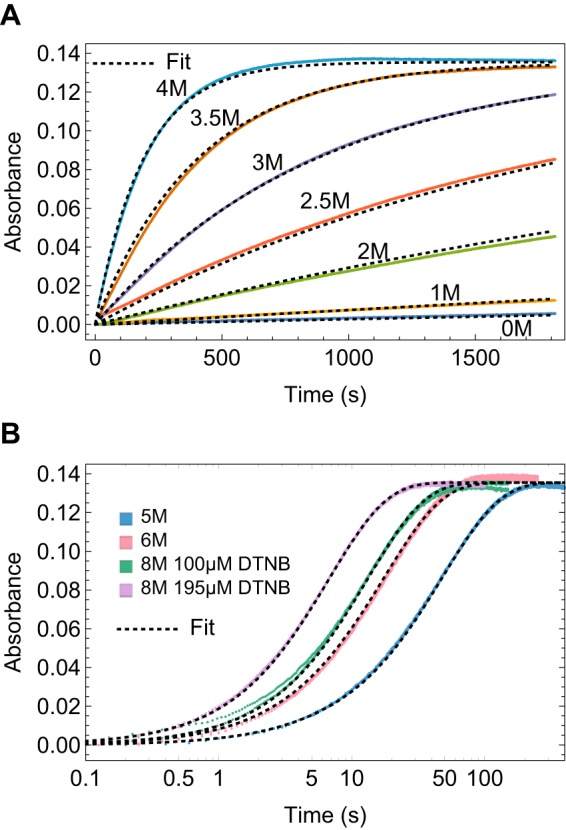
FIGURE 3.

Kinetics of labeling the buried Cys in FNIII 2C in 0–8 m urea by manual spectrophotometer (A) and stopped flow (B). Colored curves, kinetic data; dotted black lines, global fit. The transients in B are shown with a log(time) axis to better exhibit differences at short times.
