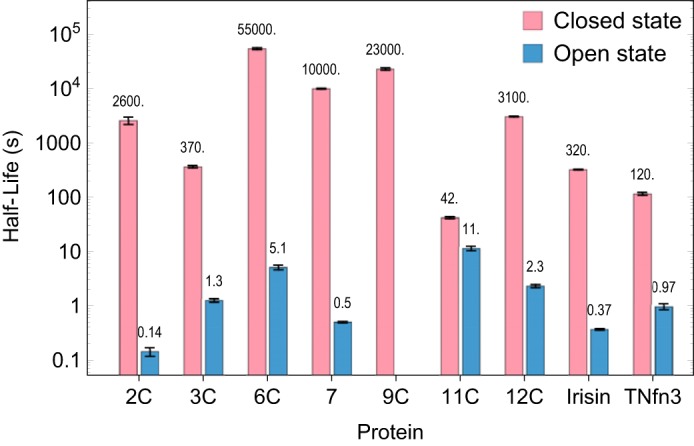
FIGURE 5.

Comparison of the closed and open state half-lives of FNIII domains as measured by SX. The error bars represent the 95% confidence intervals as estimated by Monte Carlo sampling of the fitted model against the data by the NonlinearModelFit function of MathematicaTM.
