FIGURE 3.

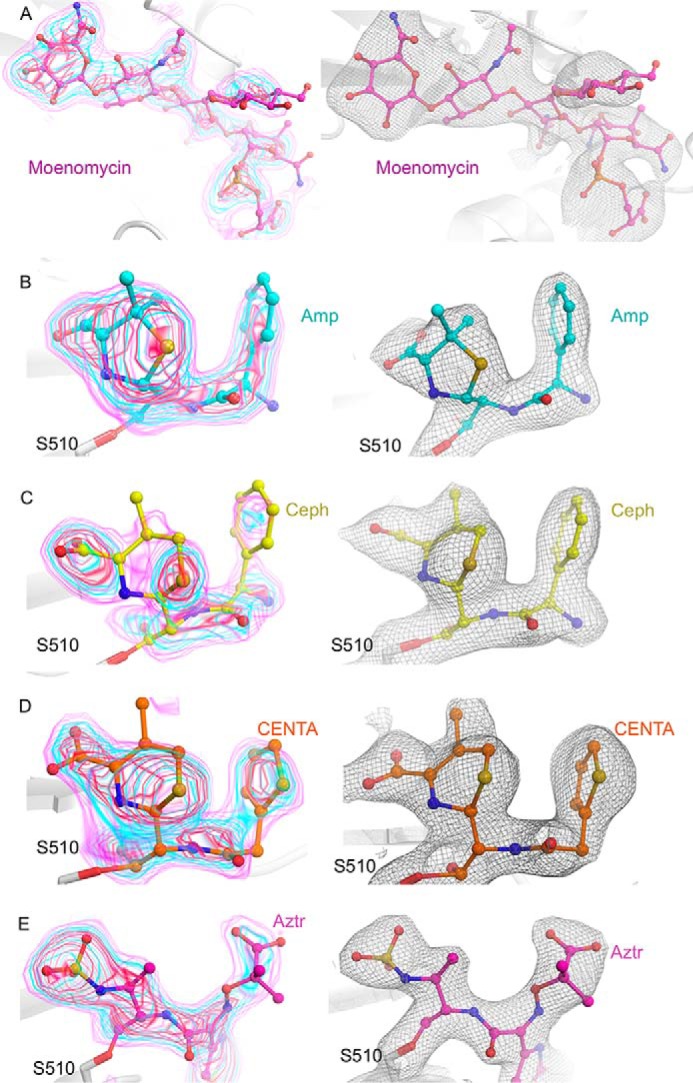
Electron density for E. coli PBP1b-bound ligands. A, moenomycin-bound to the PBP1b GTase domain. Moenomycin is represented as pink sticks with atoms colored by type. B, ampicillin-bound PBP1b TPase domain. Acyl-ampicillin is depicted as teal sticks with atoms colored by type. C, cephalexin-bound PBP1b TPase domain. Acyl-cephalexin is shown as yellow sticks with atoms colored by type. D, CENTA-bound PBP1b transpeptidase domain. Acyl-CENTA is displayed as orange sticks with non-carbon atoms colored by type. E, aztreonam-bound PBP1b TPase domain. Acyl-aztreonam is illustrated as pink sticks with atoms colored by type. In the left panels for A–E, the ligand omit Fo − Fc electron density map is displayed as pink, cyan, and red transparent surface contoured at 2.5, 3.5, and 4.5 σ. In the right panels for A–E, the final refined ligand 2Fo − Fc electron density map is shown as a gray mesh and contoured at 1.0σ.
