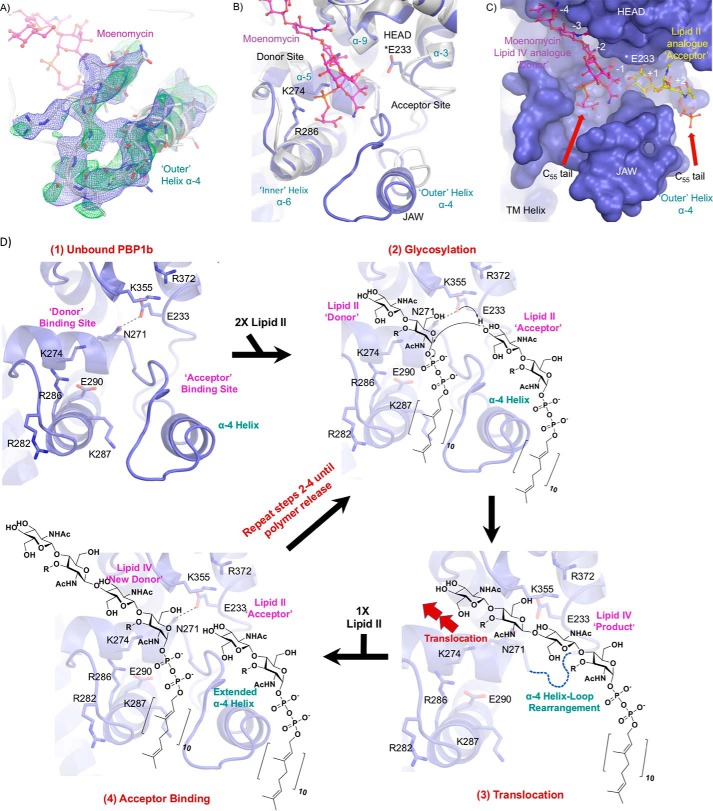
FIGURE 6.
Modeling of the active site region His240–Thr267. A, electron density for previously unresolved α-4 helix loop region of the PBP1b glycosyltransferase domain. The protein backbone is shown as a white cartoon, and individual residues are depicted in stick representation with non-carbon atoms colored by type. Moenomycin is displayed as pink sticks with atoms colored by type. The fully refined 2Fo − Fc and loop omit Fo − Fc electron density maps are displayed as blue and green mesh contoured at 0.6 and 1.5 σ. The density permits modeling of the orientation and secondary structure features of the protein backbone. However, we note that the maps do not allow for high confidence in the exact location of individual amino acid side chains throughout this region, and residues within this span of amino acids contain B-factors that are roughly 1.5 times the GTase domain average (145.0 versus 94.0 Å2). B, GTase active site overlay of E. coli PBP1b-aztreonam and the previous PBP1b moenomycin-bound structure (PDB code 3VMA). The E. coli PBP1b-aztreonam and 3VMA protein backbones are displayed in blue and white cartoon representation, with key active site residues and moenomycin in the E. coli PBP1b-aztr structure shown as sticks with non-carbon atoms colored by type. The structural overlay yielded a r.m.s.d. for all common main chain atoms of 0.8 Å between the two PBP1b structures. C, surface representation of the PBP1b GTase active site cleft. The protein is displayed as a blue surface with moenomycin depicted as in A. Huang et al. (26) solved the crystal structure of a lipid II analog bound to the monofunctional S. aureus GTase acceptor site (31% sequence identity with the E. coli PBP1b GTase domain). The S. aureus monofunctional GTase and bound ligand was overlaid onto the PBP1b-aztr GTase domain (r.m.s.d. for 42 common cα atoms: 1.2 Å) to highlight the expected general location of lipid II binding to the acceptor site. The lipid II analog is displayed as yellow sticks with non-carbon atoms colored by type. D, proposed mechanism for lipid II polymerization by PBP1b. The PBP1b protein backbone is displayed as a blue cartoon with key active site residues shown as blue sticks with non-carbon atoms colored by type.

