
FIGURE 11.
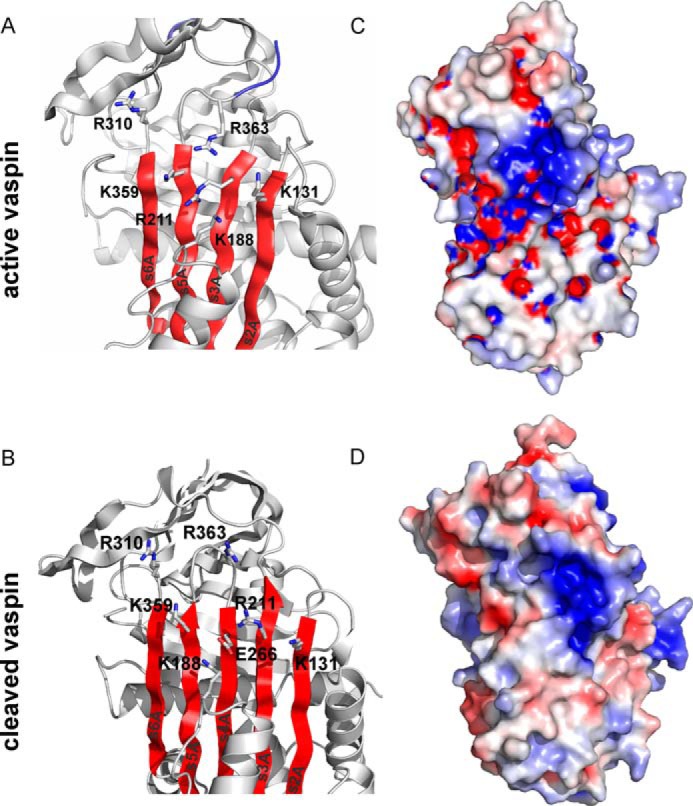
Localization of the putative heparin binding site in vaspin. A and B, a ribbon depiction is shown of the upper part of native vaspin (A, with β-sheet A in red and the RCL in blue; Protein Data Bank code: 4IF8) or cleaved vaspin (B; Protein Data Bank code 5IE0) slightly rotated from the classic view. Side chains of the identified residues contributing to heparin binding (Lys359 and Arg211) and surrounding basic residues are labeled and shown as sticks. C and D, the electrostatic surface and the ribbon diagram of the vaspin (C) and cleaved vaspin (D) molecules are presented in the same orientation as in A. Colors relate to the electrostatic surface potential (blue is positive, and red is negative, −8 to +8 kBT) calculated by APBS (37). The surface charge distribution reveals a prominent basic patch located on top of the β-sheet A.