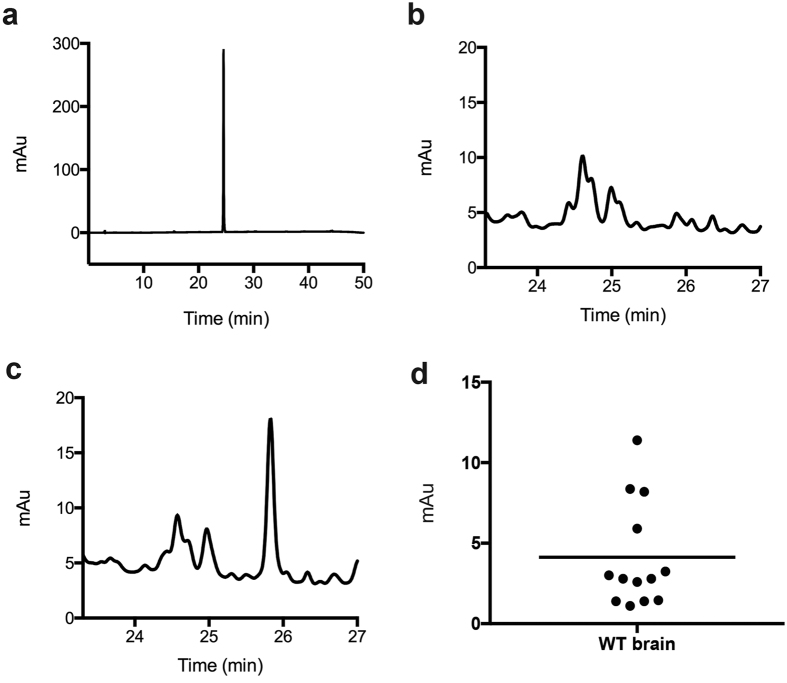
Figure 3. HPLC analysis of PTH-LK.
(a) LK standard after PITC derivatization (PTH-LK). (b) WT mouse brain homogenate after PITC derivatization. (c) WT mouse brain homogenate spiked with synthetic LK showed an increased PTH-LK signal after PITC derivatization. (d) LK level in WT mouse brains. Each data point represents one mouse. The mean value is shown.

