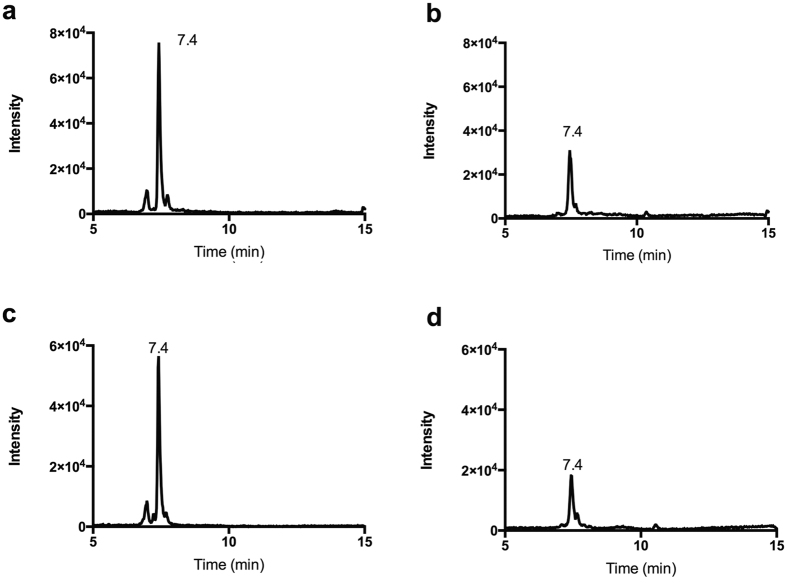
Figure 4. Multiple reaction monitoring (MRM) of LK.
MRM chromatogram for the transition of (a) 190.1 → 144.1 Da for LK, and (b) 194.1 → 148.0 Da for isotopically labeled LK in WT mouse brain. Also shown are the corresponding transitions (c) 190.1 → 144.1 Da and (d) 194.1 → 148.0 Da in LanCL1 KO mouse brain. The elution time for each peak is shown.

