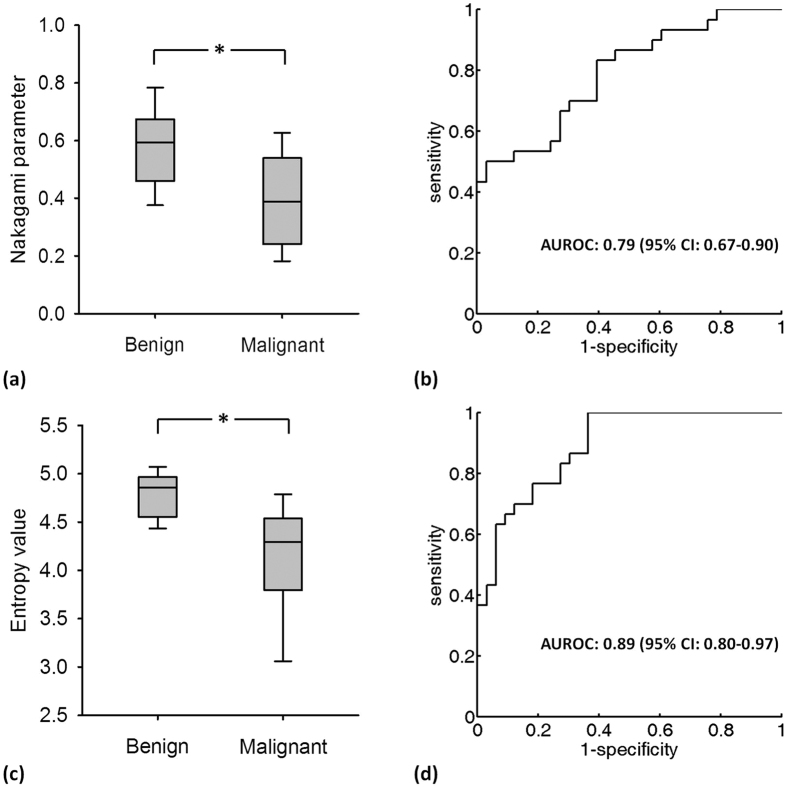
Figure 12.
(a) The median Nakagami parameters for benign and malignant tumors were 0.59 (IQR: 0.46–0.67) and 0.46 (IQR: 0.28–0.55), respectively (p < 0.05). (b) ROC curve for using the Nakagami image to classify benign and malignant tumors. The AUROC was 0.75. (c) The median entropies for benign and malignant tumors were 4.86 (IQR: 4.57–4.96) and 4.37 (IQR: 4.01–4.61), respectively (the “*” symbol indicates a p value < 0.05). (d) ROC curve for using the entropy image to classify benign and malignant tumors. The AUROC was 0.82.

