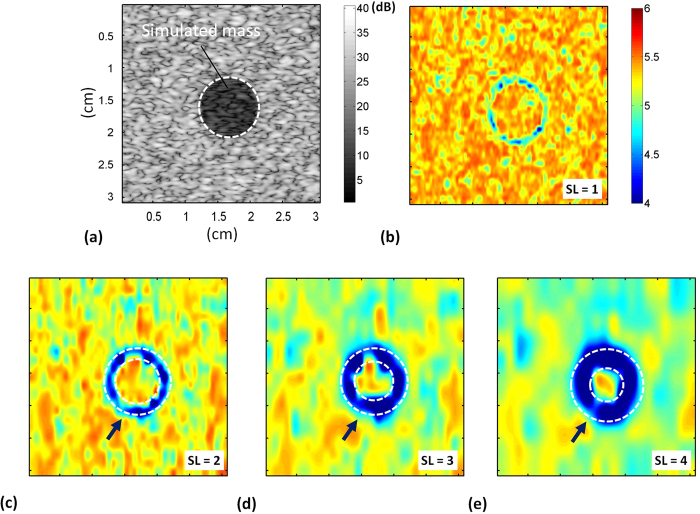
Figure 6.
(a) B-mode and (b–e) entropy images of a simulated mass obtained using windows of different sizes. (b) SL = 1; (c) SL = 2; (d) SL = 3; (e) SL = 4. The dimensions for all images are the same. The grayscale and color bars represent the pixel values (the brightness) of the B-mode and entropy images, respectively. The boundary artifact was conspicuous when windows with a large SL were used, and it gradually diminished as the SL decreased from 4 to 1.

